
Table content
Whether you’re conducting market research, looking for feedback from your staff members, or following-up with customers on their experience, surveys are a quick and easy way to connect with people and gather vital information.
By choosing LimeSurvey, you can either choose one of our many ready-to-use yet customizable survey templates or build your own survey from scratch. No matter which option is best for you, here are the steps you need to get started.
1. Create a free account
To get started, you will need a free account, here's how to create one in a few seconds. After that, your survey site will automatically be created for you.
2. Give your new survey site a name
Once you've created your account, you will automatically be directed to the creation of your survey site. All you have to do is give your new LimeSurvey environment a name.
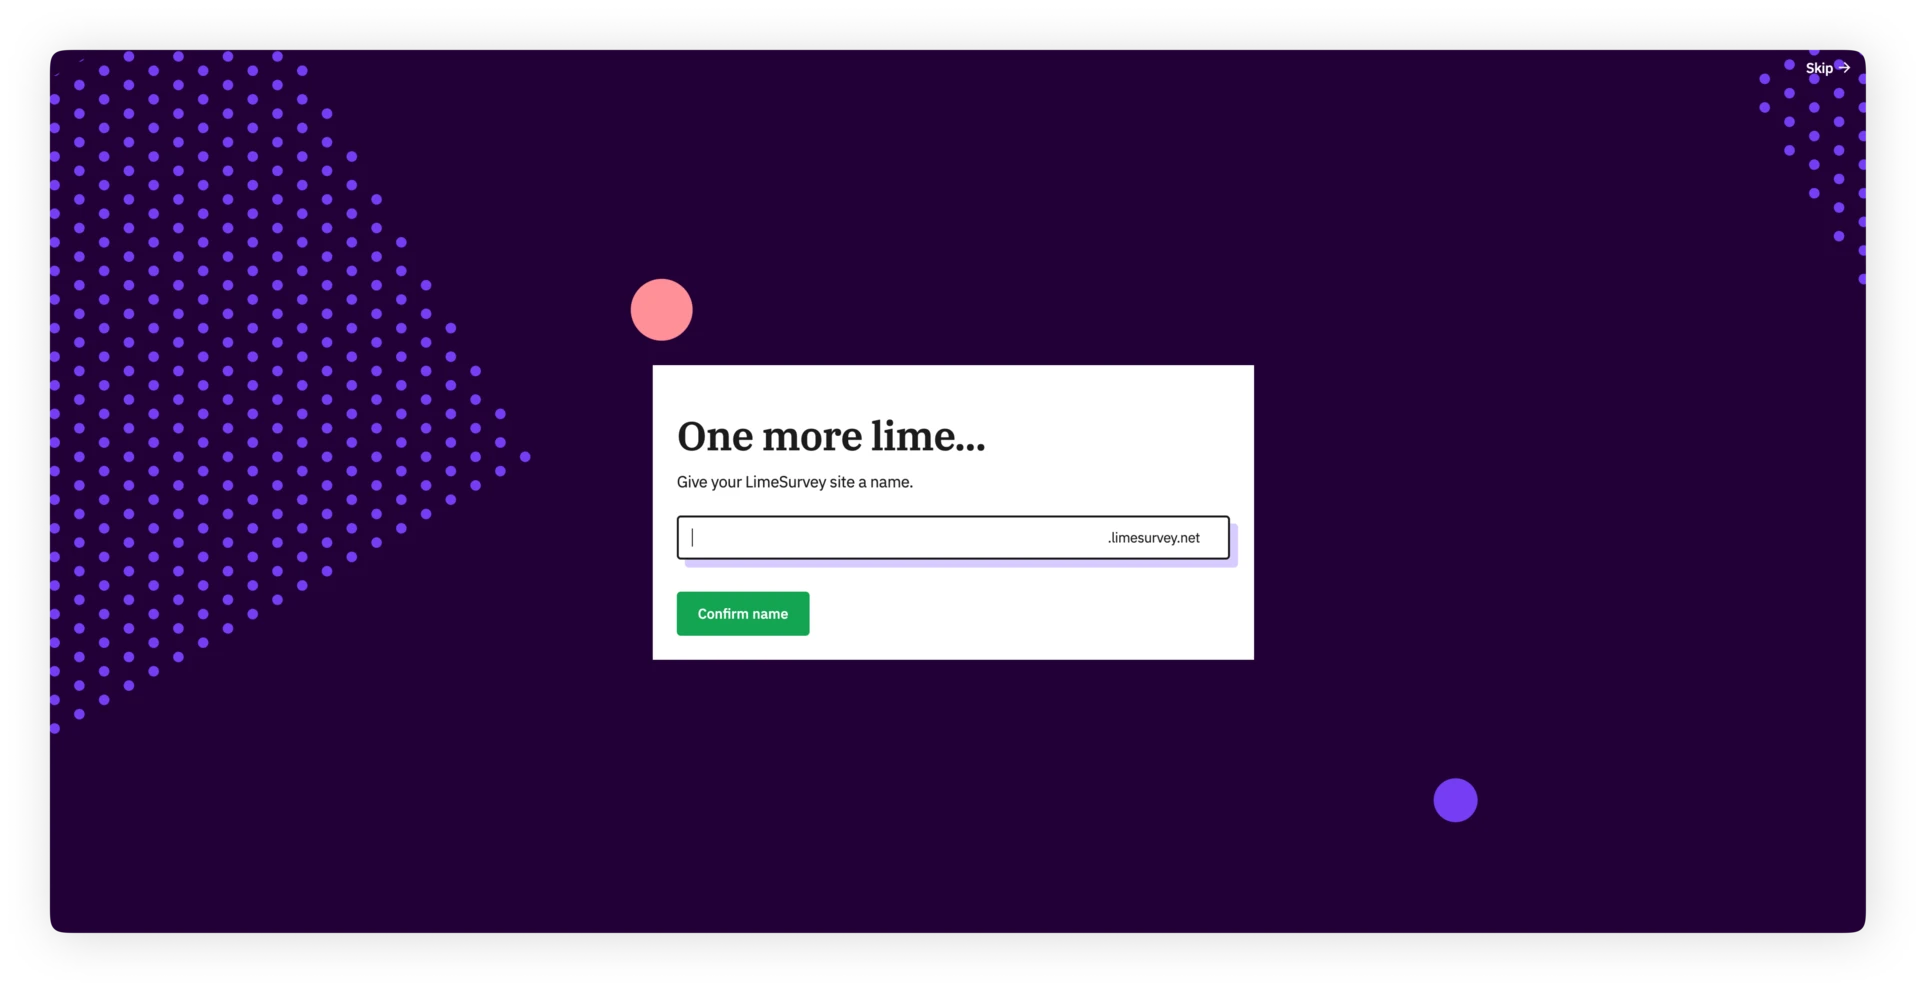
After this is done and your new site is created, you will land on your dashboard of the application.
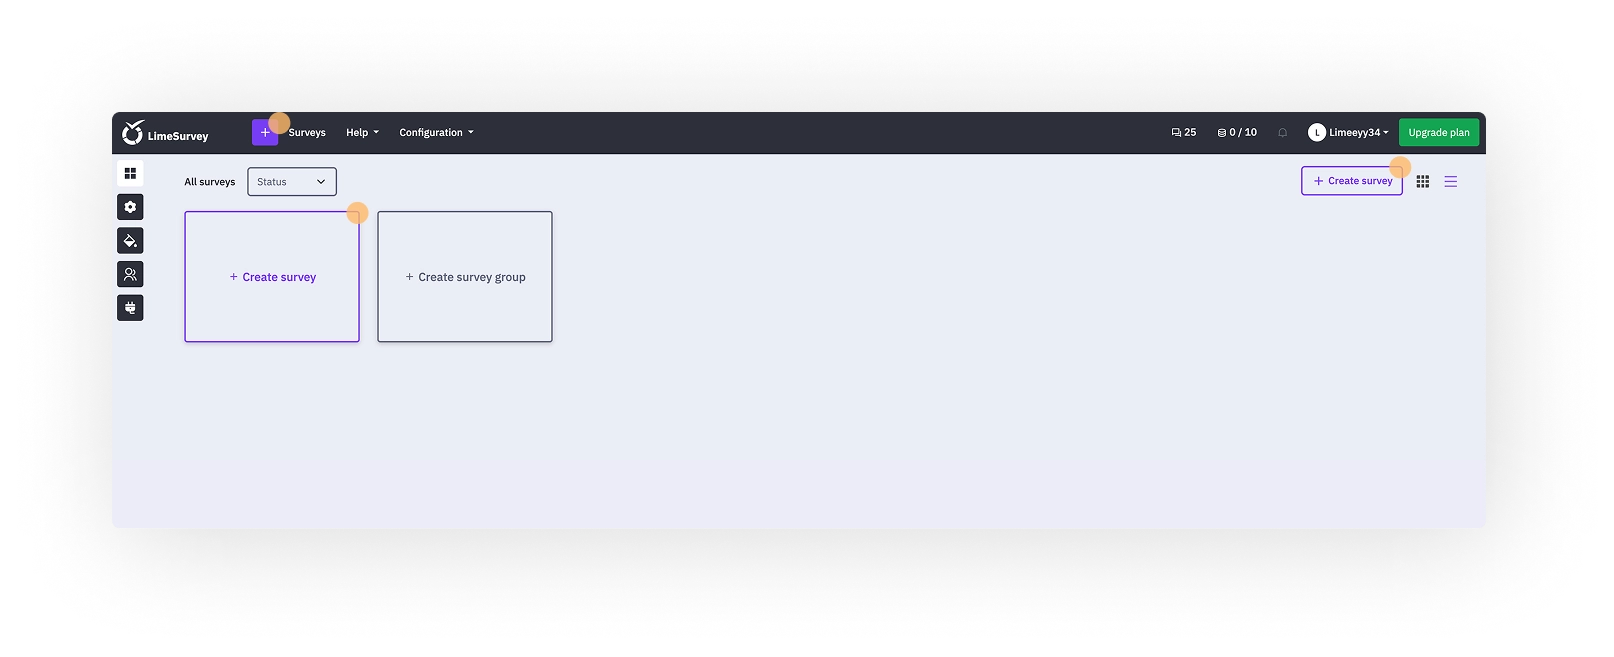
3. Create your first survey
Once you are on your dashboard, hit the "+" button from the header or the "+ create survey" card and button to start creating your first survey.
After that, you will land in the create survey section. From the create tab, simply fill in the name for your new survey, and select a base language and a survey group.
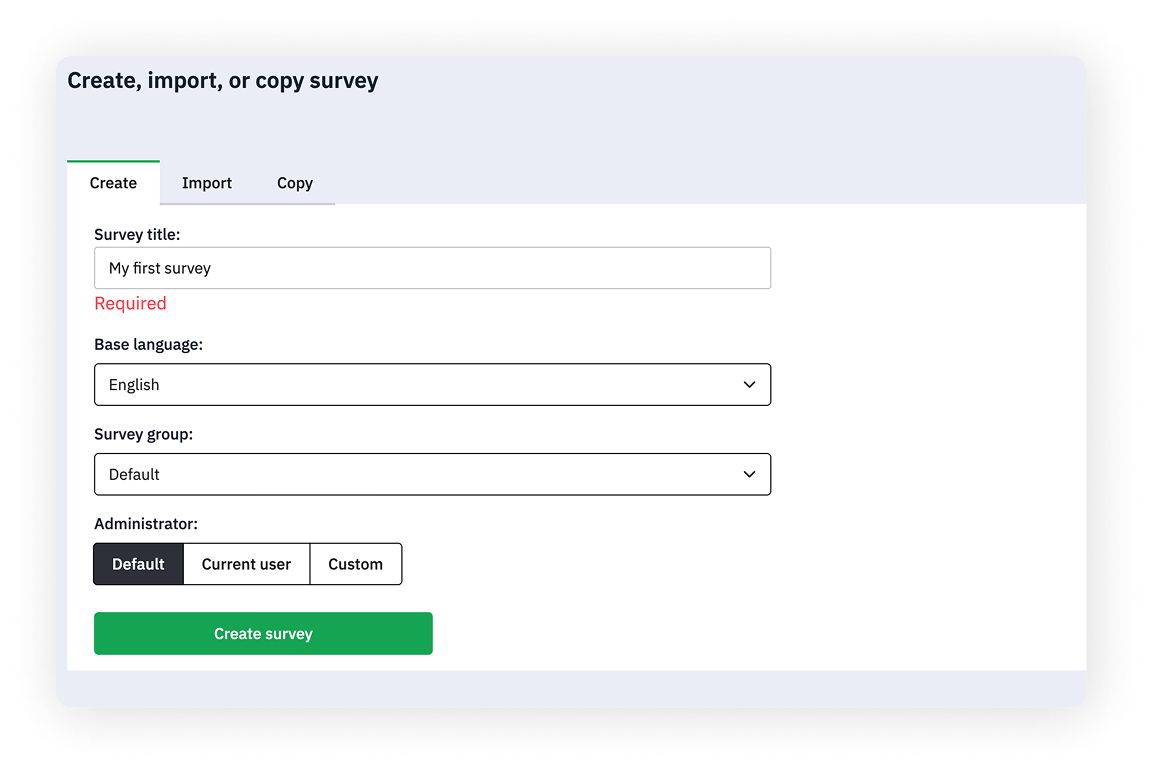
Note: If you just started with LimeSurvey, you may have no survey group yet. That's fine, you don't have to change anything there.
If you select the option "Default" here, your survey will be added to the default group, which will contain all your surveys that you did not assign to a group you created yourself.
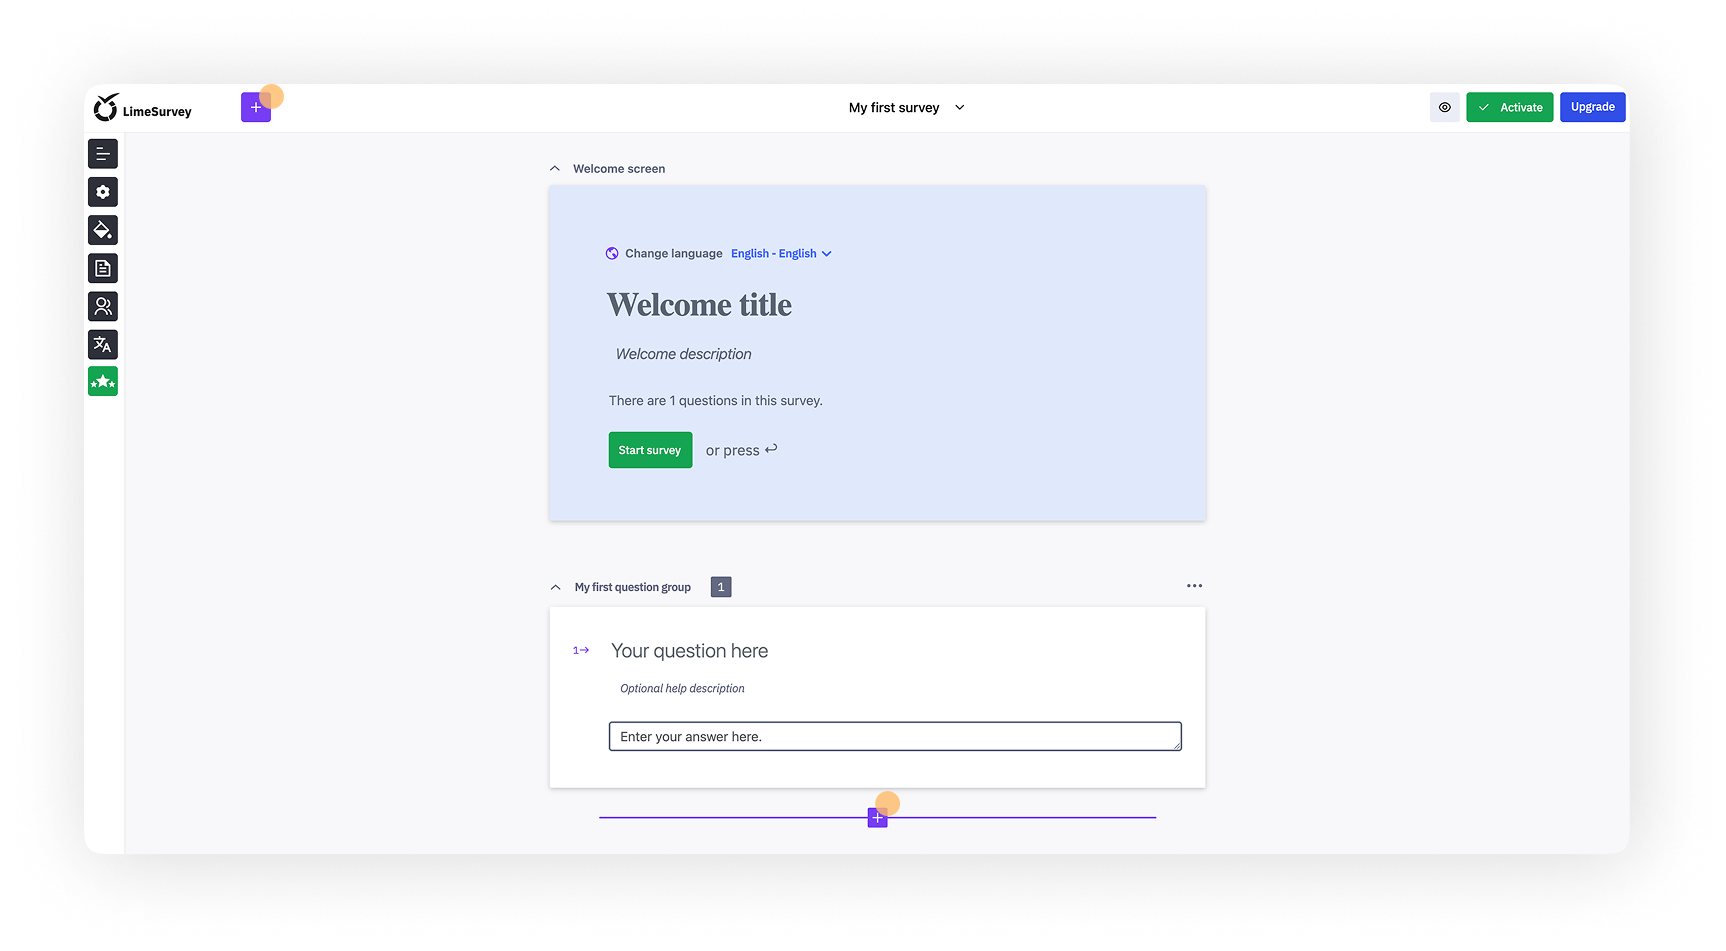
4. Land in survey editor
Next up, you will land directly inside the LimeSurvey editor.
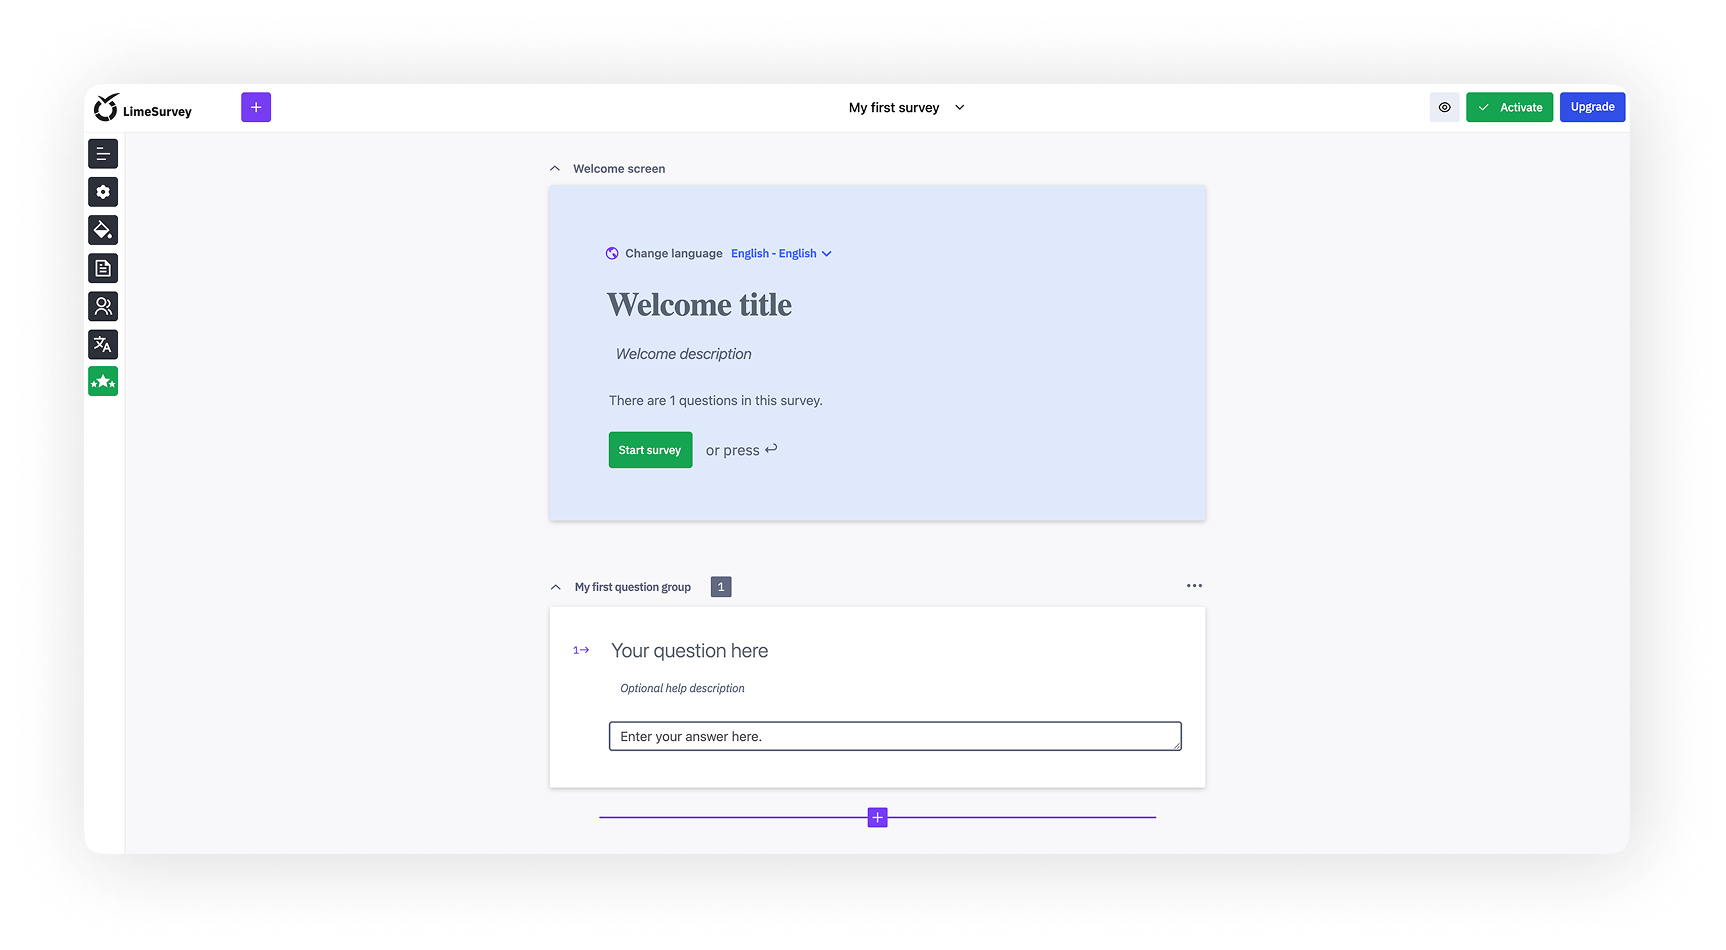
As you will notice, the first example question group and example question are, by default, always created for you. You can change the name of this question group and, of course, change the question type of the example question.
You can also simply choose to create new questions, so let's go on by doing just that.
5. Add questions to your survey
To add a new question to your survey, click the purple "+" button in the header or underneath your first example question.
After clicking one of these buttons, the question type selection menu will appear. In here, you can choose from more than 20 question types depending on your needs.
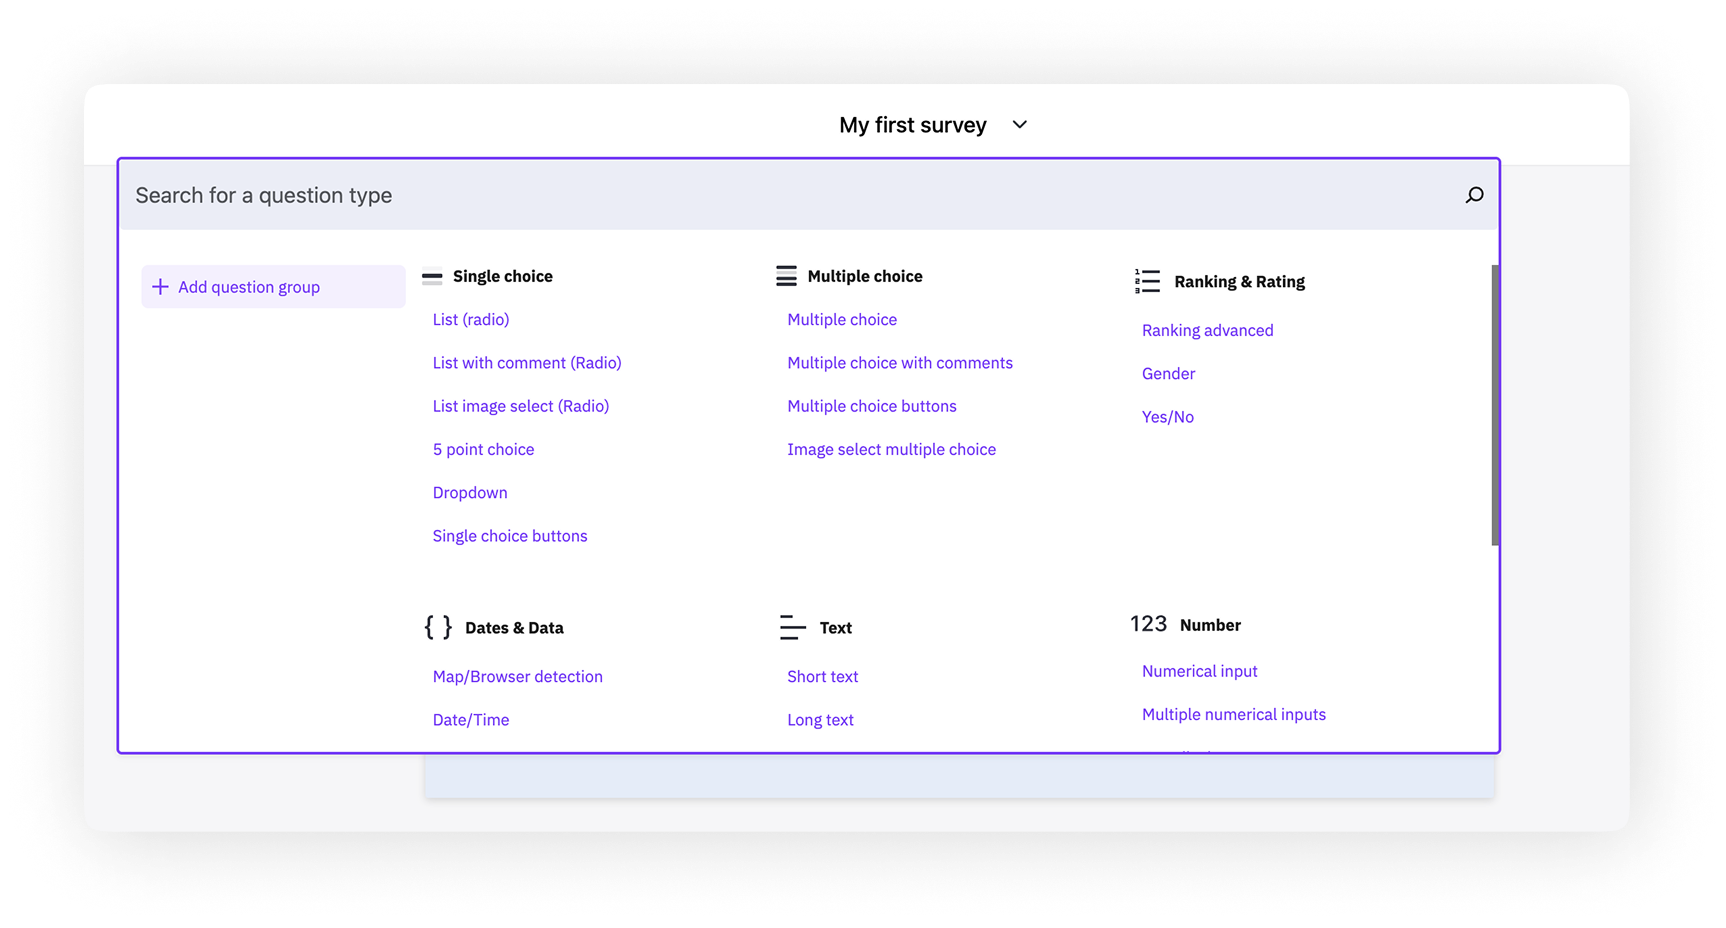
But, for the sake of simplicity, let's go with a multiple-choice question for now.
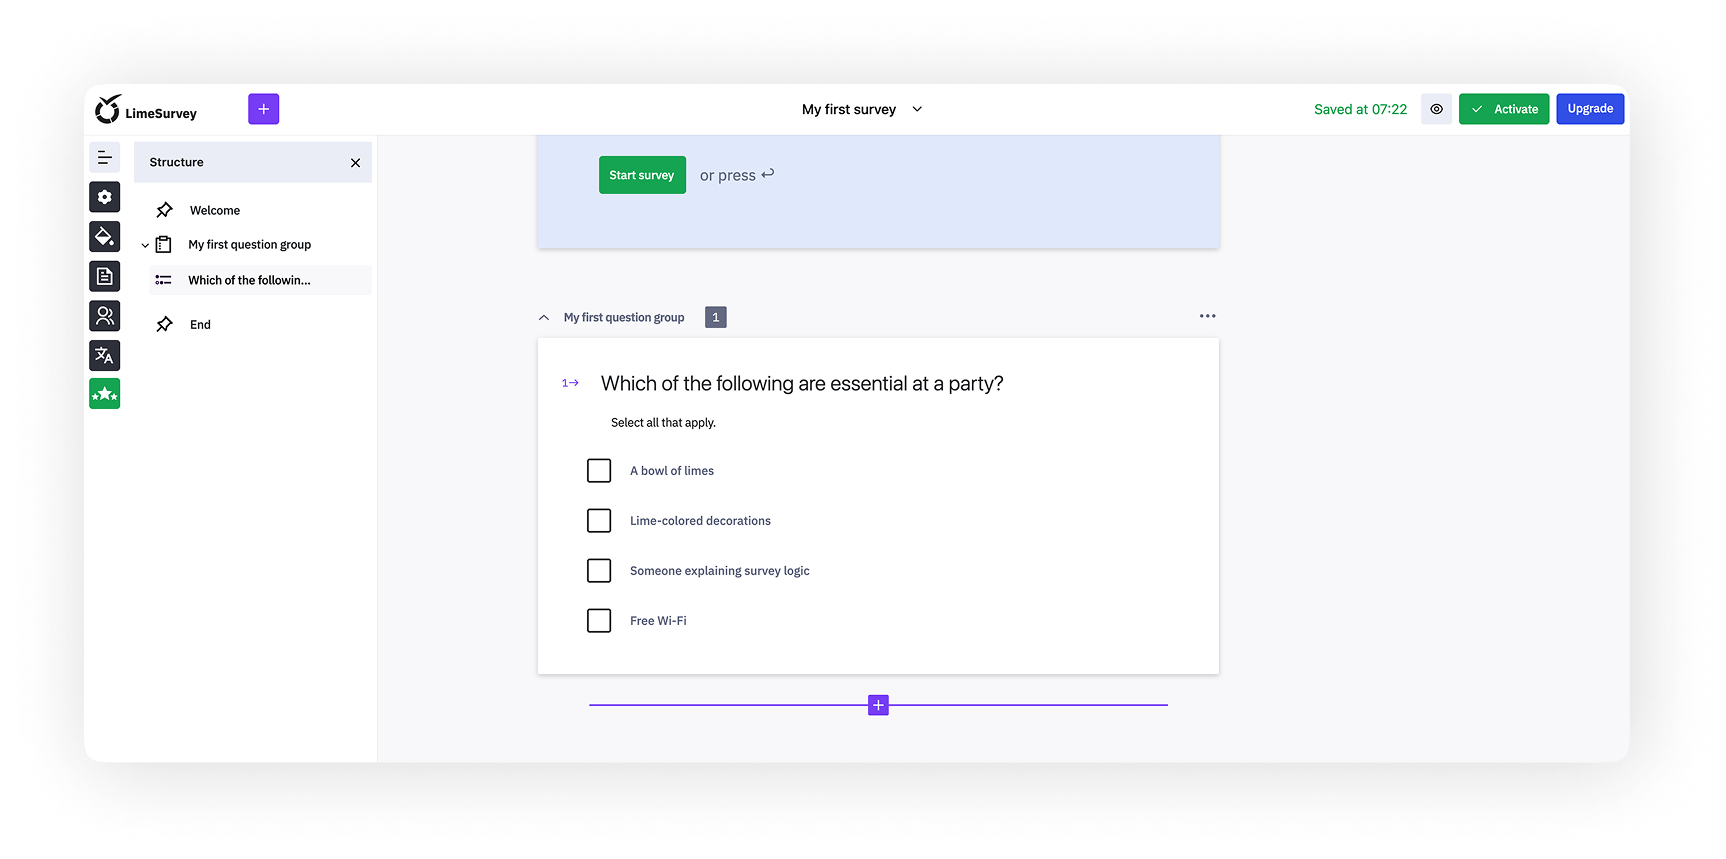
After selecting the question type, your new question will directly appear inside the editorial area. Just fill in the question text and add some answer options.

Did you know?
Once you clicked your question to edit it, you entered edit mode for the question. If you click outside of the question again, you will see the preview mode of it, so you can get a feeling of how this question will be presented to the people who take your survey in the end.
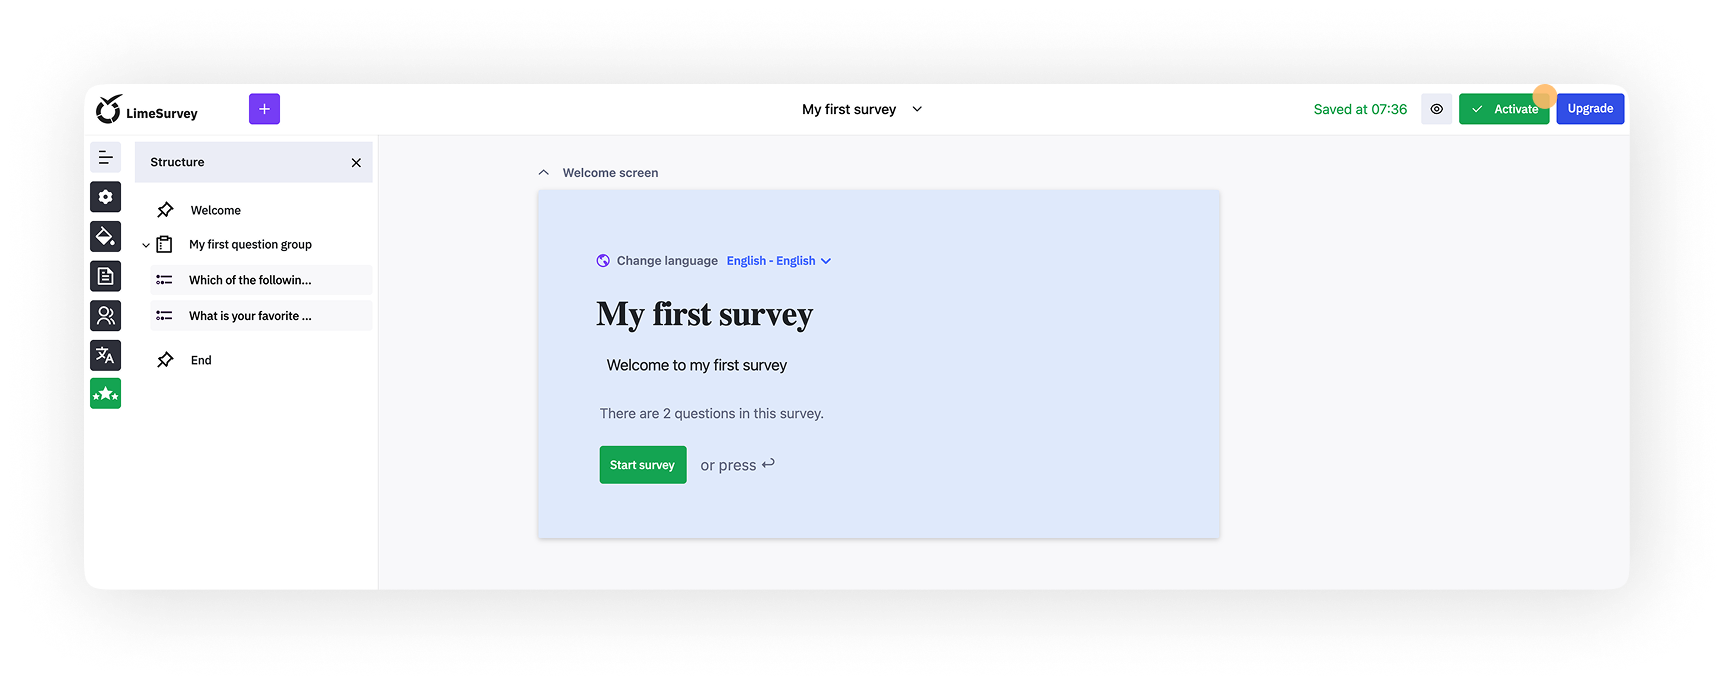
6. Activate your survey
After adding your questions and groups to your survey, you’re ready to activate your survey. To do this, select the "Activate" button in the header of the application.
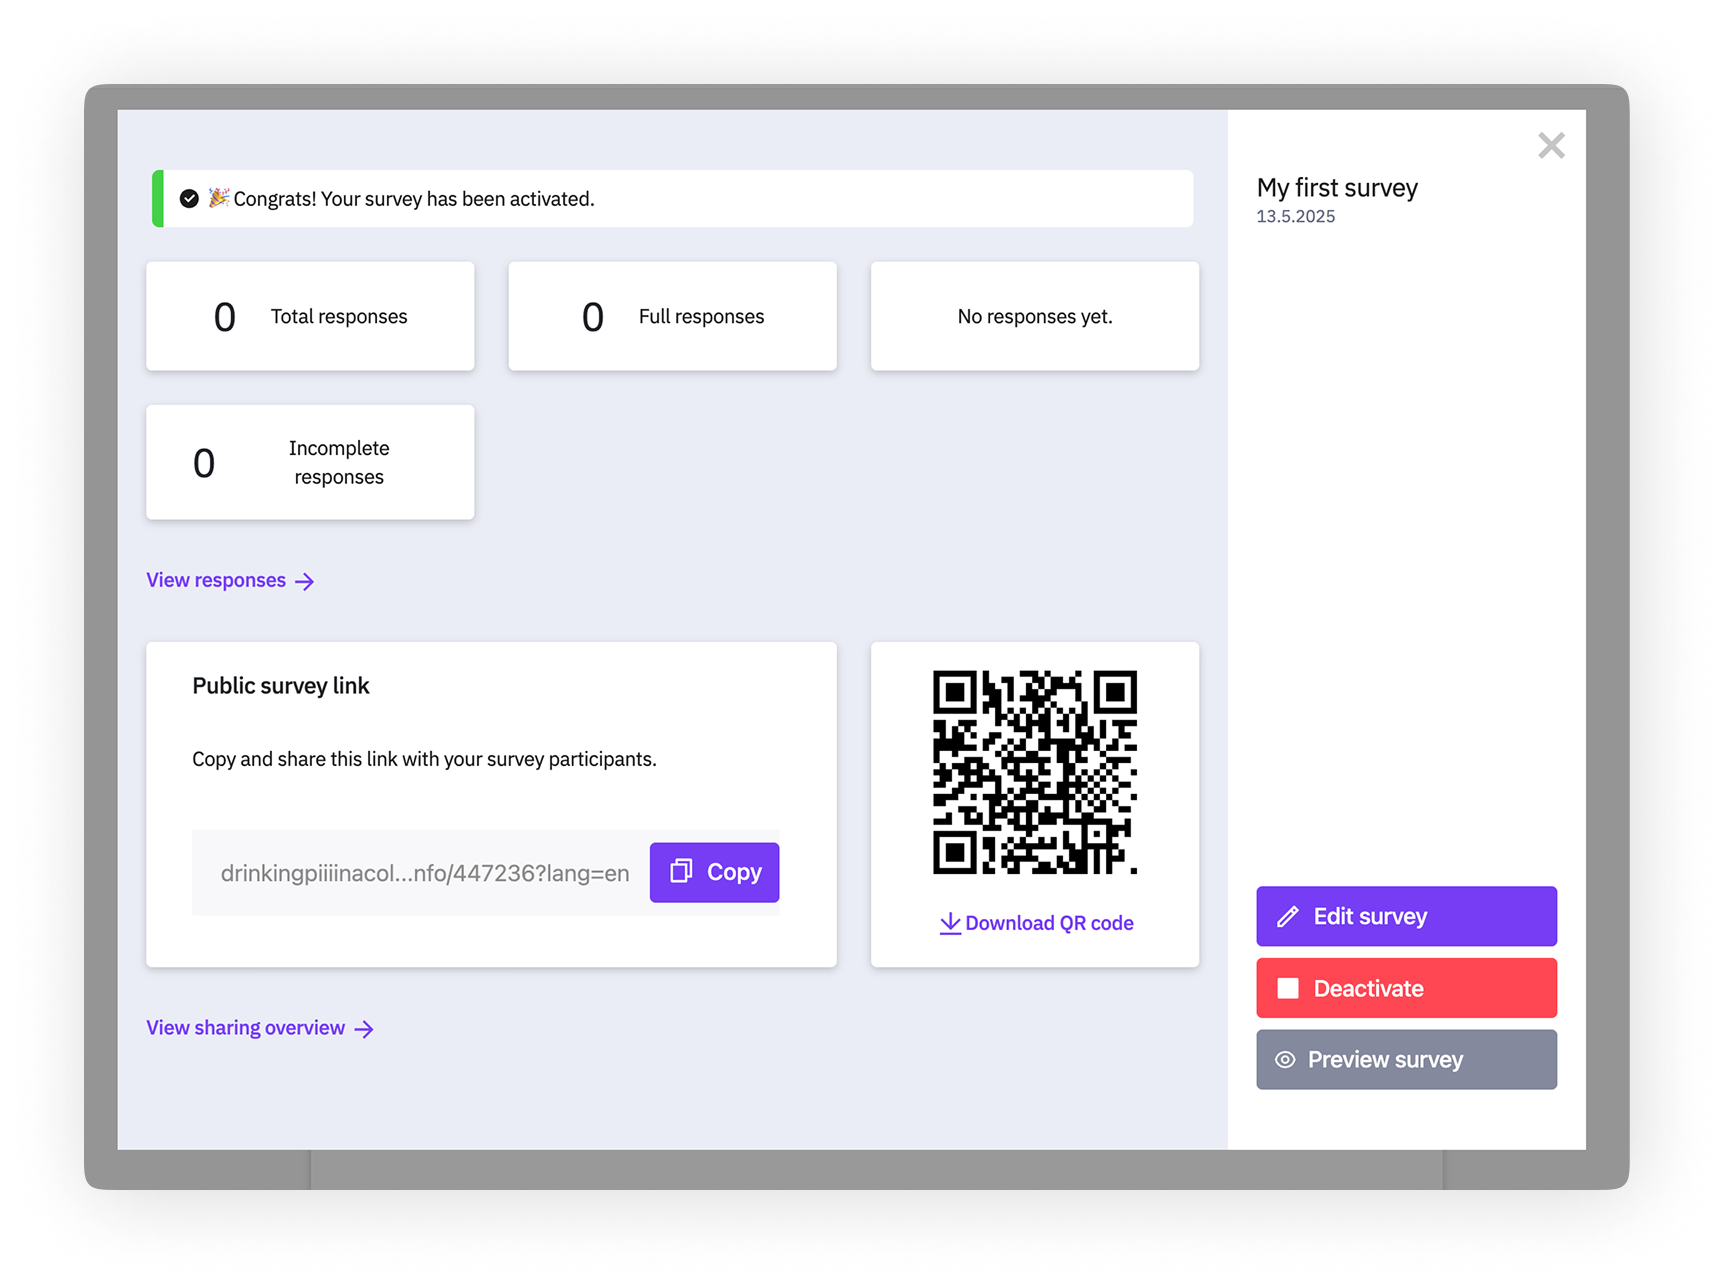
After your survey has been activated, the overview modal will appear, which provides a quick overview of the most important metrics and sharing options for your survey.
Think one step ahead.
Step into a bright future with our simple online survey tool
7. Share your survey
If you open an activated survey, the overview modal will always be shown so you can catch up on the responses you collected.
Directly from the modal, you can simply copy the survey link with one click and start sharing it. Or you choose to download a QR code, with which people can take your survey, and go on by sharing that.
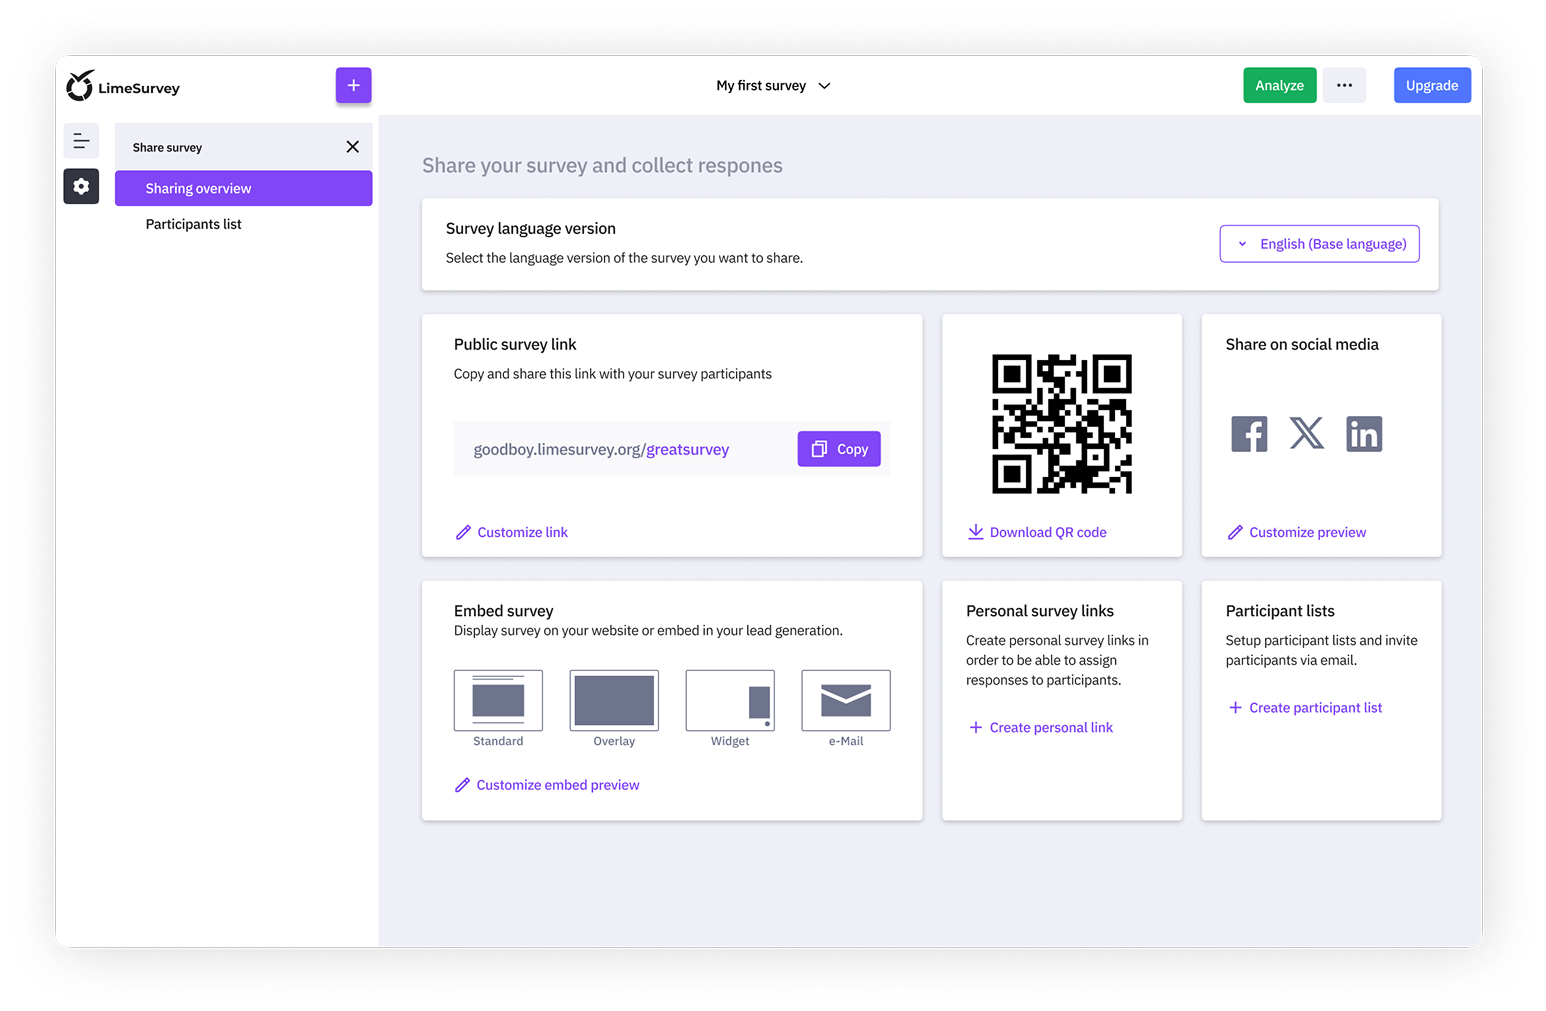
You can also follow the "View sharing overview" link on the modal to get to the sharing overview page, which provides you with a selection of all sharing options within LimeSurvey.
8. Collect Responses
To monitor your incoming responses, navigate to the "Survey menu" item in the menu bar, choose "Responses", and then see your response summary as an overview or the detailed responses in the table underneath it.
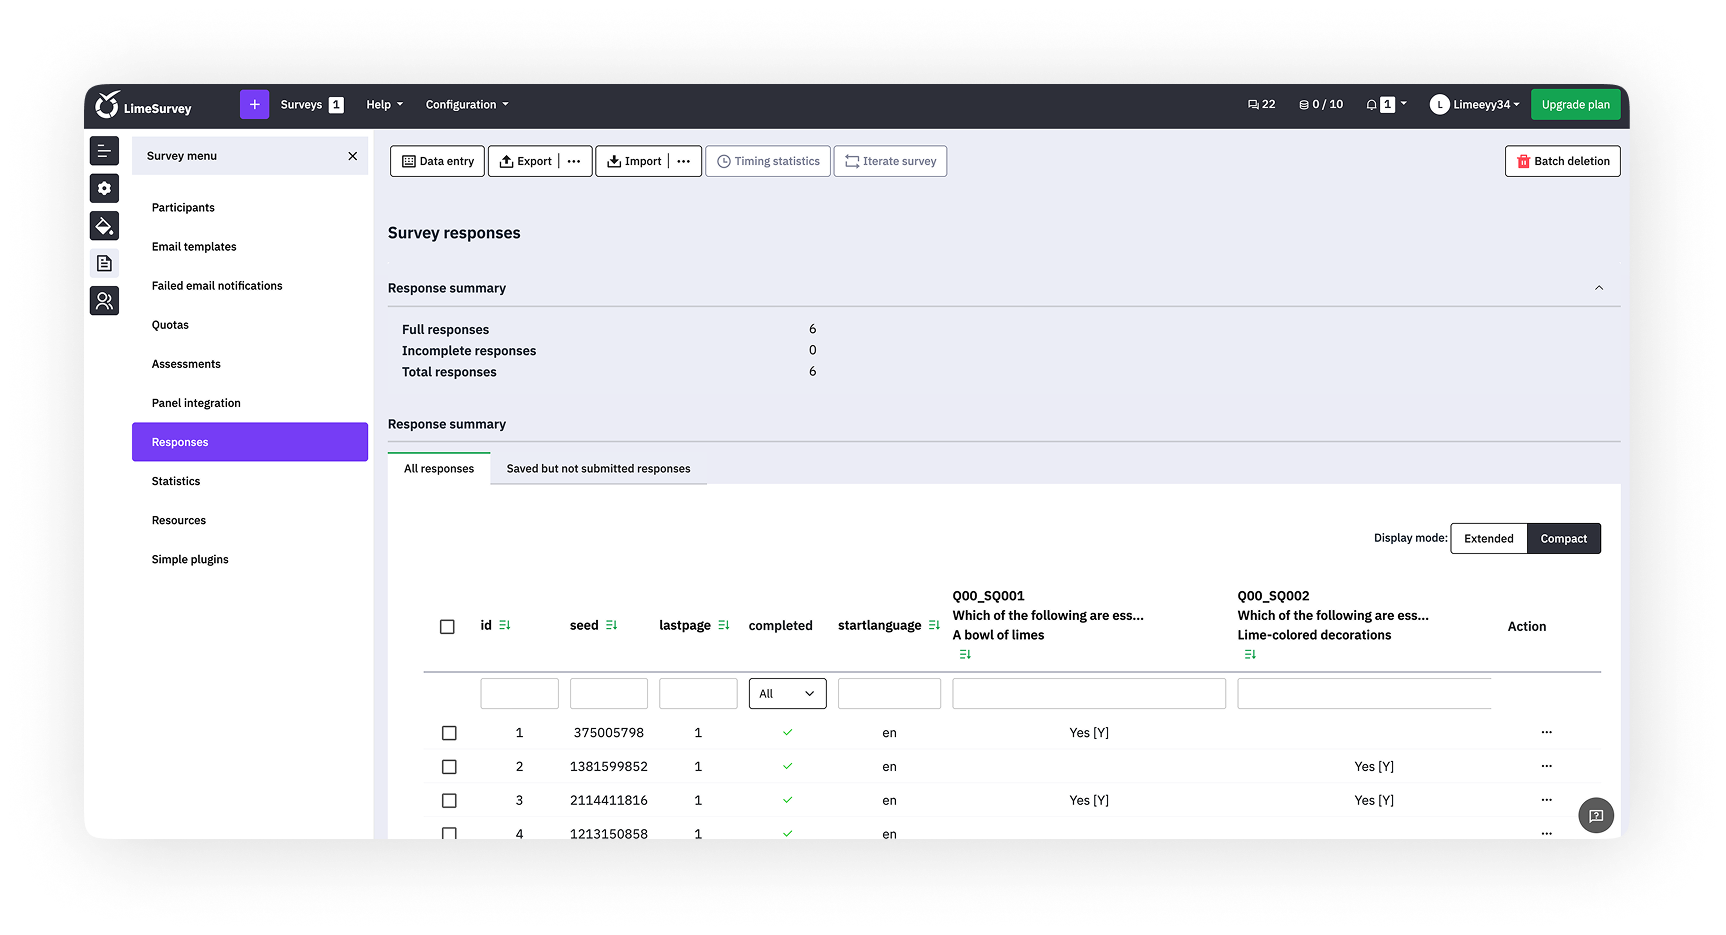
From there, you can use an array of filters to choose how to display the responses.
To ensure the integrity and quality of your survey data, use the check data integrity function to vet consistency and determine redundancy. This function looks for possible errors that might exist between the response tables and survey tables, or between the token list and the central participant database.
9. Analyze Results
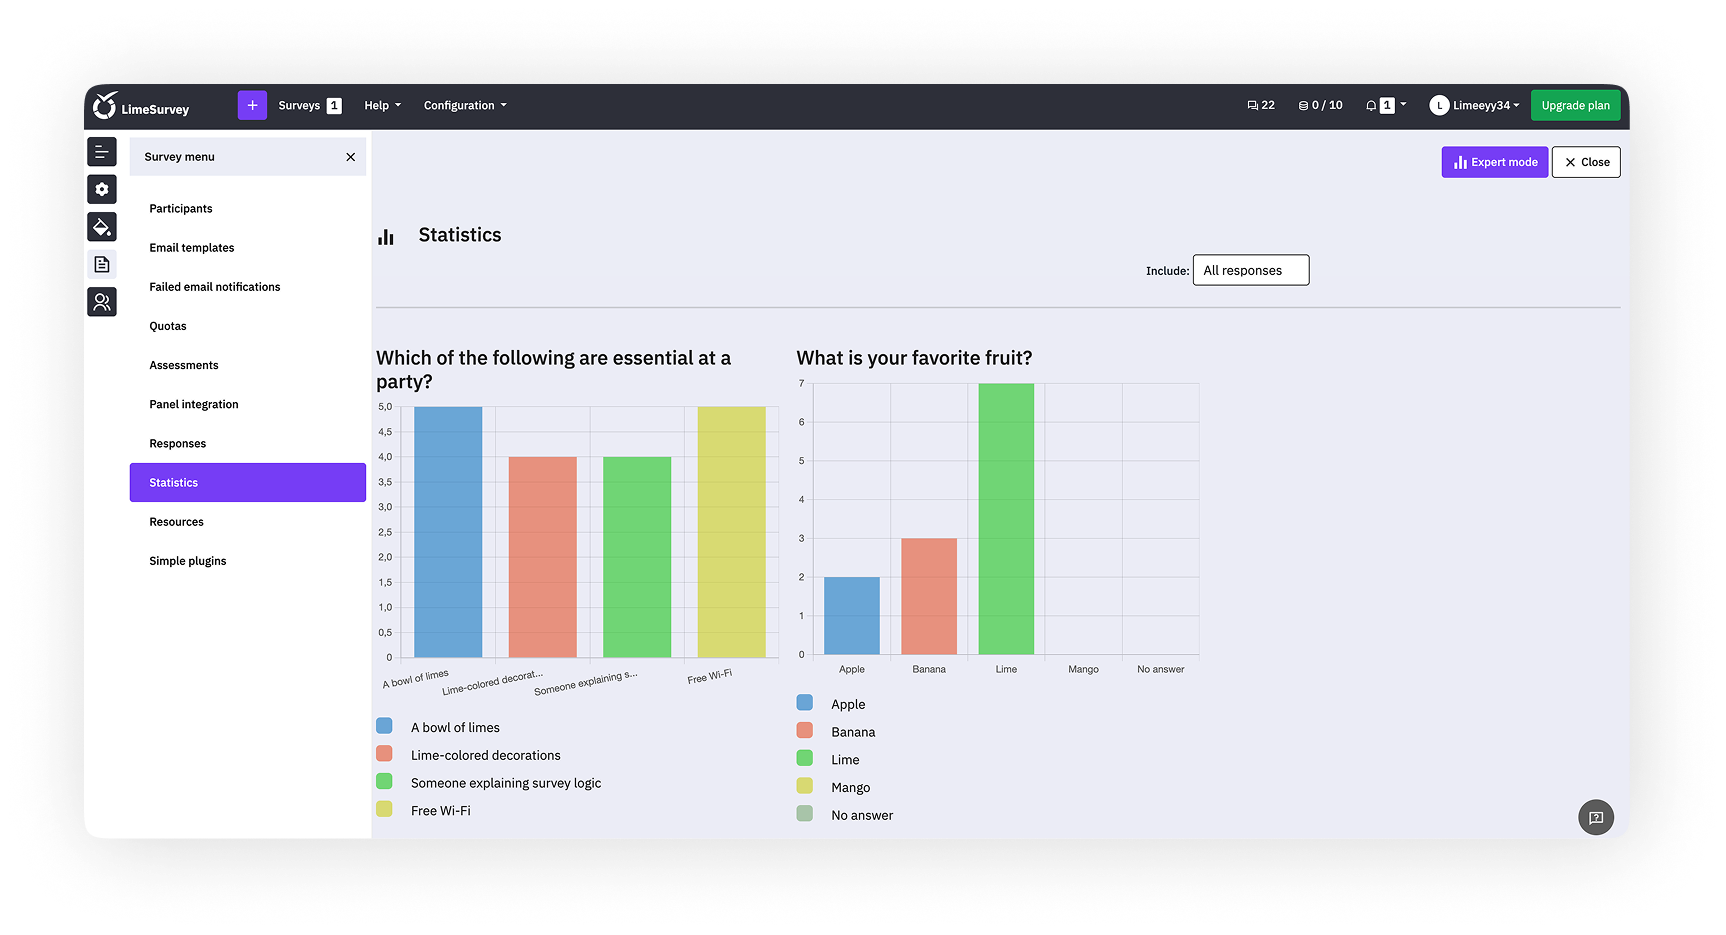
Once all responses are collected and you have decided to close your survey, it’s time to dig in and analyze the results.
With LimeSurvey’s analysis tools, you can create simple and complex statistics using the response table and field summary, filter the data as needed, and generate graphs and charts. To access these tools, click "Statistics", then choose the function you want to use.
For additional external analysis, you can export your survey data in a variety of formats that are compatible with tools such as SPSS, R, STATA, and more.
To export survey data, find “Responses” from the "Survey menu", click “Export”, and then select your desired export format.
To save any graphs and charts that you’ve generated using LimeSurvey’s tools, use the “Export images” function and choose your desired format.
With LimeSurvey, you can quickly and easily create and customize surveys that suit your needs. For more information on getting started or using our vast array of tools, check out our robust Help Center or start your own survey now.