Table content
LimeSurvey has come a long way since its early days. What started as a simple survey tool with an open-source concept has evolved into a powerful, feature-packed platform that supports complex surveys and in-depth data collection. But with all that growth comes a challenge: how do you make it easier to navigate, more intuitive, and less overwhelming for both new and experienced users?
That’s where LimeSurvey’s latest UI and UX updates come in. These changes focus on improving the user experience while keeping the platform’s robust functionality intact.
Whether you’re an experienced survey pro or just starting to explore LimeSurvey, these updates are designed to make the process faster, smoother, and more enjoyable.
Easy Surveys for Everyone
Picture this: You plan to open a shop selling flowers. But how do you determine the right price for your bouquets? Setting it too low might make customers question the quality, while a price that’s too high might drive customers away.
It’s a critical consideration. Pricing missteps can mean loss of revenue, inventory issues, and brand perception challenges should you decide to increase or decrease your prices later on.
Luckily, business owners don’t have to take a shot in the dark and hope the price works out for the best. The Van Westendorp Pricing Model can help identify a price range that aligns with customer expectations and profitability goals.
What is the Van Westendorp Pricing Model?
Also known as the Price Sensitivity Meter, the Van Westendorp Pricing Model uses targeted questions to uncover the price that customers perceive as fair, revealing insights that can shape effective pricing strategies.
Instead of setting prices based on costs alone, companies can use this approach to gauge how customers will likely respond to different price points and better understand the price sensitivity of a desired audience.
Using this information, businesses can set prices that maximize sales and reflect product value. For example, Apple positions its products at a premium, while discount retailers like Xiaomi and Honor keep prices low to appeal to a value-focused audience. Companies that skip price sensitivity research risk pricing themselves out of the market or failing to convey value effectively.
Comparing Different Pricing Optimization Methods: Van Westendorp vs. Gabor Granger
When exploring pricing strategies, it’s useful to compare different models to understand their unique strengths and applications. For instance, the Van Westendorp and Gabor-Granger models offer distinct approaches to pricing research.
While the Van Westendorp model evaluates a broad range of price acceptability, the Gabor-Granger method tests price elasticity by asking respondents if they would purchase at specific price points. Both methods provide valuable insights, with Van Westendorp focusing on acceptable price ranges and Gabor-Granger pinpointing the exact willingness to pay. Together, they offer complementary perspectives on pricing strategy.
Key Van Westendorp Pricing Questions
The Van Westendorp model relies on four core questions to reveal customer price thresholds. These are:
- At what price would you consider the product to be too expensive?
- At what price would you question the quality of this product?
- What price feels like a bargain for this product?
- At what price does the product seem expensive but acceptable?
If customers frequently pick a very low price for “too cheap,” it may indicate a perception issue with the product’s quality. On the other hand, if “too expensive” responses cluster near the higher end of expected pricing, it may suggest the market could support a premium price.
With LimeSurvey, businesses can create these surveys using customizable templates designed for ease of use.
Plotting a Van Westendorp Graph
After gathering survey responses, Excel can be a helpful tool for plotting the data to visualize the price sensitivity meter. Start by organizing responses into four price columns.
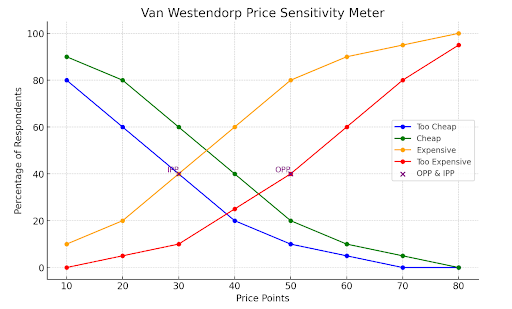
Using Excel’s graphing features, plot each response set, noting where the lines intersect to reveal critical points: the optimal price point (OPP), where the balance between affordable and expensive aligns with customer willingness, and the indifference price point (IPP), where customers start to find the product neither too cheap nor too expensive. These intersections help businesses identify price levels where customers perceive the product as fairly priced. Adding visuals of the process, such as a sample Excel setup, can further clarify the steps.
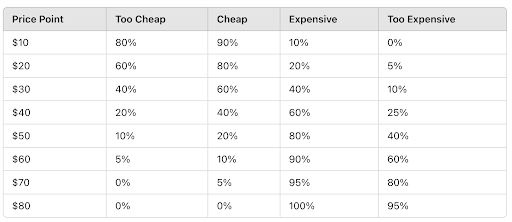
- Price Point: Represents various price levels tested in the survey.
- Too Cheap: Percentage of respondents who feel the product is priced too low at this level, potentially questioning quality.
- Cheap: Percentage of respondents who consider the price low, but acceptable.
- Expensive: Percentage of respondents who find the price high, but still acceptable.
- Too Expensive: Percentage of respondents who find the price excessively high.
Plotting and Calculating in Excel:
- Enter Data: Place the data from your survey into an Excel sheet with separate columns for each category.
- Create a Line Graph: Use the line chart feature to plot each price category (Too Cheap, Cheap, Expensive, Too Expensive) as a line on the graph.
- Identify Intersections:
- The intersection of “Too Cheap” and “Expensive” indicates the Indifference Price Point (IPP).
- The intersection of “Cheap” and “Too Expensive” marks the Optimal Price Point (OPP).
Interpreting the Van Westendorp Price Sensitivity Meter
The Optimal Price Point (OPP) is where the Cheap and Too Expensive lines intersect, roughly between $40 to $50 in this example. This is where customers find the price reasonable, maximizing sales potential. The Indifference Price Point (IPP), where Too Cheap and Expensive intersect, is around $30. This point represents where customers start viewing the price as balanced, neither too low nor too high.
Knowing these points can help adjust pricing strategies. For instance, a luxury brand might target slightly above the OPP, while a discount brand might stay closer to the IPP to capture more price-sensitive buyers.
Advantages and Limitations
The Van Westendorp model offers many benefits, such as simplicity and minimal cost compared to extensive market testing. However, it does rely on perceptions rather than actual purchase behavior, which can introduce bias.
Additionally, customer-reported price acceptability may shift in real-life contexts. To address these limitations, companies may supplement the Van Westendorp model with A/B testing and market studies, ensuring that pricing decisions are informed across different customer segments.
Best Practices for Price Sensitivity Analysis
To get the most reliable results from a price sensitivity analysis, businesses should consider surveying diverse groups periodically. LimeSurvey’s reach allows businesses to target diverse respondent groups, ensuring the sample reflects actual customer demographics.
Features like skip logic and conditional questions may further enhance survey quality. Regularly updating price sensitivity data helps businesses adjust to changing market conditions, as economic factors and competitor pricing often influence customer price expectations.
Survey templates for Van Westendorp price optimization
View all 800+ LimeSurvey’s customizable templates!
Create your Van Westendorp Survey on LimeSurvey
The Van Westendorp pricing model is a valuable tool for businesses seeking to understand customer price preferences. With the flexibility of LimeSurvey, creating and managing these surveys becomes much simpler, giving businesses quick access to customer insights. Start refining your pricing strategy today with LimeSurvey’s templates, and take the guesswork out of setting the right price.