- Posts: 40
- Thank you received: 4
Welcome to the LimeSurvey Community Forum
Ask the community, share ideas, and connect with other LimeSurvey users!
bug au niveau de l'affichage des stat sur les camembert en mode stat
- pberthol
-
 Topic Author
- Offline
- Senior Member
-

Less
More
6 years 11 months ago #154541
by pberthol
bug au niveau de l'affichage des stat sur les camembert en mode stat was created by pberthol
Bonjour,
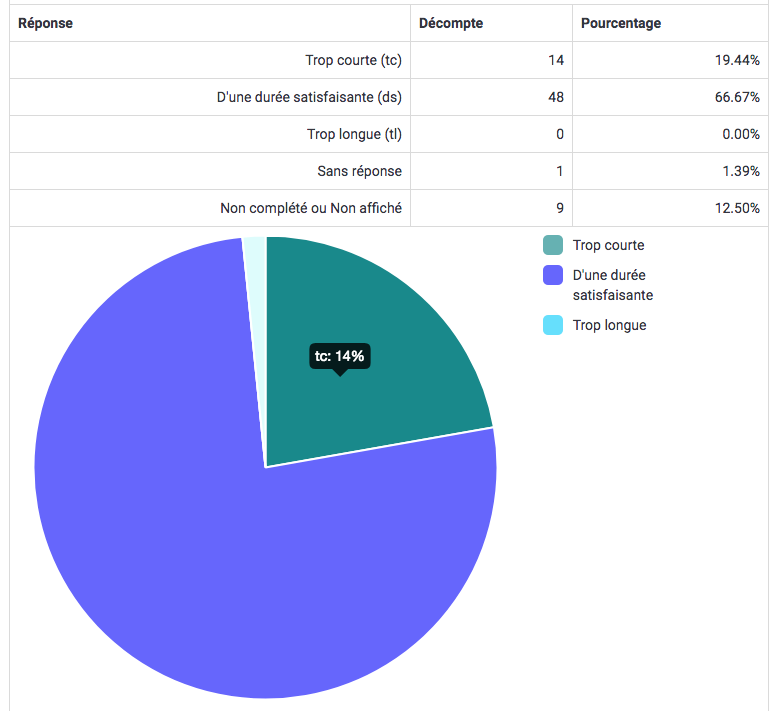
Nous avons observé un bug au niveau de l'affichage des stats sur les camembert en mode statistique expert :
en effet lors du passage de a souris le décompte est affiché avec la mention % au lieu du pourcentage ce qui crée un confusion cf capture ci joint
cordialement,
Version 2.63.1+170305
Nous avons observé un bug au niveau de l'affichage des stats sur les camembert en mode statistique expert :
en effet lors du passage de a souris le décompte est affiché avec la mention % au lieu du pourcentage ce qui crée un confusion cf capture ci joint
cordialement,
Version 2.63.1+170305
Attachments:
The topic has been locked.

- Nickko
-

- Offline
- LimeSurvey Community Team
-

Less
More
- Posts: 1955
- Thank you received: 410
6 years 11 months ago #154618
by Nickko
Nickko
Head of ergonomics, UX & UI.
Replied by Nickko on topic bug au niveau de l'affichage des stat sur les camembert en mode stat
Merci mais ce n'est pas ici qu'il faut signaler les bug. C'est dans le bug tracker, menu communauté en haut de ce cette page.
Il faut bien sûr vérifier qu'il soit nouveau, il est inutile de signaler une seconde fois un bug qui figure déjà dans le bug tracker, en revanche, il peut être intéressant d'ajouter vos informations si elles sont plus complètes que celles qui figurent déjà dans la description du bug.
Il faut bien sûr vérifier qu'il soit nouveau, il est inutile de signaler une seconde fois un bug qui figure déjà dans le bug tracker, en revanche, il peut être intéressant d'ajouter vos informations si elles sont plus complètes que celles qui figurent déjà dans la description du bug.
Nickko
Head of ergonomics, UX & UI.
The topic has been locked.
- pberthol
-
Topic Author
- Offline
- Senior Member
-
Less
More
- Posts: 40
- Thank you received: 4
6 years 6 months ago #159084
by pberthol
Replied by pberthol on topic bug au niveau de l'affichage des stat sur les camembert en mode stat
Bonjour,
Bug rapporté ici :
apparemment affecté mais pas corrigé
bugs.limesurvey.org/view.php?id=12489
y'a t'il moyen d'avoir des infos sur l'origine du bug afin que je puisse créer temporairement un fix en attendant la version
corrigée ?
Bug rapporté ici :
apparemment affecté mais pas corrigé
bugs.limesurvey.org/view.php?id=12489
y'a t'il moyen d'avoir des infos sur l'origine du bug afin que je puisse créer temporairement un fix en attendant la version
corrigée ?
The following user(s) said Thank You: DenisChenu
The topic has been locked.
- Nickko
-
- Offline
- LimeSurvey Community Team
-
Less
More
- Posts: 1955
- Thank you received: 410
6 years 6 months ago #159087
by Nickko
Nickko
Head of ergonomics, UX & UI.
Replied by Nickko on topic bug au niveau de l'affichage des stat sur les camembert en mode stat
Puisque c'est toi qui a rapporté le bug, c'est toi qui a le plus d'info...
Nickko
Head of ergonomics, UX & UI.
The topic has been locked.
- DenisChenu
-

- Offline
- LimeSurvey Community Team
-
Less
More
- Posts: 13648
- Thank you received: 2491
6 years 6 months ago #159157
by DenisChenu
github.com/LimeSurvey/LimeSurvey/blob/master/CONTRIBUTING.md
Un logiciel libre n'évolu que par ses contributeurs
Assistance on LimeSurvey forum and LimeSurvey core development are on my free time.
I'm not a LimeSurvey GmbH member, professional service on demand , plugin development .
I don't answer to private message.
Replied by DenisChenu on topic bug au niveau de l'affichage des stat sur les camembert en mode stat
Si tu trouve un correctif : hésite pas à proposer ce correctif, c'est tout de même le meilleuir moyen …pberthol wrote: y'a t'il moyen d'avoir des infos sur l'origine du bug afin que je puisse créer temporairement un fix en attendant la version
corrigée ?
github.com/LimeSurvey/LimeSurvey/blob/master/CONTRIBUTING.md
Un logiciel libre n'évolu que par ses contributeurs
Assistance on LimeSurvey forum and LimeSurvey core development are on my free time.
I'm not a LimeSurvey GmbH member, professional service on demand , plugin development .
I don't answer to private message.
The topic has been locked.
- pberthol
-
Topic Author
- Offline
- Senior Member
-
Less
More
- Posts: 40
- Thank you received: 4
6 years 4 months ago - 6 years 4 months ago #161782
by pberthol
Replied by pberthol on topic bug au niveau de l'affichage des stat sur les camembert en mode stat
2 petits correctif maison comme je ne suis pas un grand spécialiste le pose ici parcequ'il sont moche :
le premier : on enleve le pourcentage de la bulle :
rdv sur
limesurvey/scripts/admin/statistics.js
ligne 180 à peu pret
on modifie :
par
voila c'est moche, mais juste
le deuxieme
on decide de convertir les chiffre en pourcentage on garde le signe % mais on calcul le percentage associé :
code original :
ligne 140 a peu pret
rdv sur
limesurvey/scripts/admin/statistics.js
en :
explication : création d'une variable "max" qui calcul le total des valeur de chaque camenbert
le premier : on enleve le pourcentage de la bulle :
rdv sur
limesurvey/scripts/admin/statistics.js
ligne 180 à peu pret
on modifie :
Code:
var $options = {
        tooltipTemplate: "<%if (label){%><%=label %>: <%}%><%= value + '%' %>",
    };
par
Code:
var $options = {
        tooltipTemplate: "<%if (label){%><%=label %>: <%}%><%= value %>",
    };
voila c'est moche, mais juste
le deuxieme
on decide de convertir les chiffre en pourcentage on garde le signe % mais on calcul le percentage associé :
code original :
ligne 140 a peu pret
rdv sur
limesurvey/scripts/admin/statistics.js
Code:
/**
 * This function load the graphs needing datas (pie chart, polar, Doughnut)
 */

function init_chart_js_graph_with_datas($type,$qid)
{
    var canvasId  = 'chartjs-'+$qid;
    var $canvas   = document.getElementById(canvasId).getContext("2d");
    var $canva    = $('#'+canvasId);
    var $color    = $canva.data('color');
    var $statistics = statisticsData['quid'+$qid];
    if($statistics == undefined) return;
    var $labels   = $statistics.labels
    var $grawdata = $statistics.grawdata
    var $chartDef = new Array();

    $('#legend-no-percent-'+$qid).hide();
    $('#legend-percent-'+$qid).show();
    $('#stat-no-answer-'+$qid).show();


    $.each($labels, function($i, $label) {
        $colori = (parseInt($i)+$color);


        $chartDef[$i] = {
            value: $grawdata[$i],
            color:"rgba("+COLORS_FOR_SURVEY[$colori]+",0.6)",
            highlight: "rgba("+COLORS_FOR_SURVEY[$colori]+",0.9)",
            label: $label,
        };
    });
    var $options = {
        tooltipTemplate: "<%if (label){%><%=label %>: <%}%><%= value + '%' %>",
    };

    if (typeof chartjs != "undefined") {
        if (typeof chartjs[$qid] != "undefined") {
            window.chartjs[$qid].destroy();
        }
    }

    window.chartjs[$qid] = new Chart($canvas)[$type](
        $chartDef,
        $options
    );
}
en :
Code:
/**
 * This function load the graphs needing datas (pie chart, polar, Doughnut)
 */

function init_chart_js_graph_with_datas($type,$qid)
{
    var canvasId  = 'chartjs-'+$qid;
    var $canvas   = document.getElementById(canvasId).getContext("2d");
    var $canva    = $('#'+canvasId);
    var $color    = $canva.data('color');
    var $statistics = statisticsData['quid'+$qid];
    if($statistics == undefined) return;
    var $labels   = $statistics.labels
    var $grawdata = $statistics.grawdata
    var $chartDef = new Array();
    var max = 0;

    $('#legend-no-percent-'+$qid).hide();
    $('#legend-percent-'+$qid).show();
    $('#stat-no-answer-'+$qid).show();

    $.each($labels, function($i, $label) {
        max = max + parseInt($grawdata[$i]);
    });

    $.each($labels, function($i, $label) {
        $colori = (parseInt($i)+$color);


        $chartDef[$i] = {
            value: Math.floor(($grawdata[$i]/max)*100),
            color:"rgba("+COLORS_FOR_SURVEY[$colori]+",0.6)",
            highlight: "rgba("+COLORS_FOR_SURVEY[$colori]+",0.9)",
            label: $label,
        };
    });
    var $options = {
        tooltipTemplate: "<%if (label){%><%=label %>: <%}%><%= value + '%' %>",
    };

    if (typeof chartjs != "undefined") {
        if (typeof chartjs[$qid] != "undefined") {
            window.chartjs[$qid].destroy();
        }
    }

    window.chartjs[$qid] = new Chart($canvas)[$type](
        $chartDef,
        $options
    );
}
explication : création d'une variable "max" qui calcul le total des valeur de chaque camenbert
Last edit: 6 years 4 months ago by pberthol.
The following user(s) said Thank You: ereaconseil
The topic has been locked.
- LouisGac
-
- Visitor
-

6 years 1 hour ago #167952
by LouisGac
Replied by LouisGac on topic bug au niveau de l'affichage des stat sur les camembert en mode stat
bon ça a l'air d'un correctif très sympa, je n'avais pas vu ce post.
Denis tu l'as testé?
Denis tu l'as testé?
The topic has been locked.
- dominikvitt
-
- Visitor
-
5 years 5 months ago #176691
by dominikvitt
Replied by dominikvitt on topic bug au niveau de l'affichage des stat sur les camembert en mode stat
It is fixed in version 3.15.4., the patch is using this code.
github.com/LimeSurvey/LimeSurvey/commit/...7e6d391ca32accc10370
github.com/LimeSurvey/LimeSurvey/commit/...7e6d391ca32accc10370
The topic has been locked.
Moderators: Nickko