- Posts: 12941
- Thank you received: 3979
Welcome to the LimeSurvey Community Forum
Ask the community, share ideas, and connect with other LimeSurvey users!
Generate statistics from matrix question group with equation
- Joffm
-

- Offline
- LimeSurvey Community Team
-

Less
More
1 month 3 weeks ago #257892
by Joffm
But in my opinion this approach is not the best.
We always see this so called "statistics" as a quick overview during the data collecting.
The final analysis should be done in a different tool and also the creating of charts.
In this case you only need the calculated value (in your equation).
It is stored and exported.
Another way ist to use the notification email, where you may insert these values.
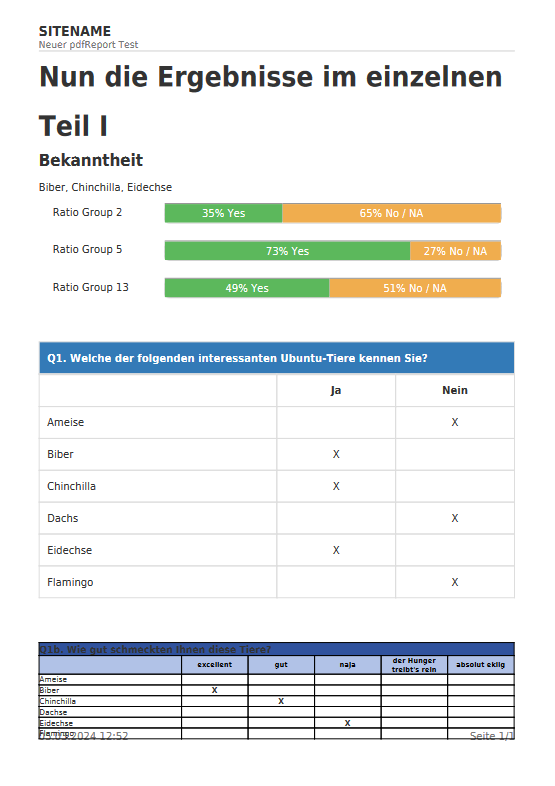
Or - more sophisticated - you use the plugin "pdfReport" and get this report in the notification mail.
Joffm
Volunteers are not paid.
Not because they are worthless, but because they are priceless
Replied by Joffm on topic Generate statistics from matrix question group with equation
As you see in the filter options you only can filter the answer id. to identify a response.and then only display the answers that person gave
But in my opinion this approach is not the best.
We always see this so called "statistics" as a quick overview during the data collecting.
The final analysis should be done in a different tool and also the creating of charts.
In this case you only need the calculated value (in your equation).
It is stored and exported.
Another way ist to use the notification email, where you may insert these values.
Or - more sophisticated - you use the plugin "pdfReport" and get this report in the notification mail.
Joffm
Volunteers are not paid.
Not because they are worthless, but because they are priceless
Please Log in to join the conversation.
- CarinaHinterberger
-
 Topic Author
- Offline
- New Member
-

Less
More
- Posts: 6
- Thank you received: 0
1 month 3 weeks ago #258075
by CarinaHinterberger
Replied by CarinaHinterberger on topic Generate statistics from matrix question group with equation
Thank you so much for your help so far! I think I want to use pdfReport, but I am not certain how to create the according equation. I still want to display the summary of each group as a chart. Is this possible with the pdfReport?
If I only want to count the “Yes” answers, but I also need the value of the overall possible answers(e.g. 4 out of 10 answers in a give group are “Yes”) how can I creat a formula in the equation type question, which can plot a chart? I understand how I can sum up the given amount of the “Yes” answers, (sumif…) but how do I account for the second value and how do I have to incorporate it in the equation in order to have two values for my chart?
Have a lovely day,
Carina
Please Log in to join the conversation.
- Joffm
-
- Offline
- LimeSurvey Community Team
-
Less
More
- Posts: 12941
- Thank you received: 3979
1 month 3 weeks ago #258077
by Joffm
Volunteers are not paid.
Not because they are worthless, but because they are priceless
Replied by Joffm on topic Generate statistics from matrix question group with equation
You wrote in your first post
But I can't believe that you coded the answer options "Yes", "No", "n/a".
So, what are the codes?
Here I take
1: Yes
2: No
9: DK
Knowing that you have two equations, maybe named "G05Yes" and "G05No"
1. {sumifop("==","1",that.G05Q01.NAOK,that.G05Q02.NAOK,that.G05Q03.NAOK,...)} all questions of the group
2. {sumifop("!=","1",that.G05Q01.NAOK,that.G05Q02.NAOK,that.G05Q03.NAOK,...)} all questions of the group
Now the chart.
After you made sure that it is possible to include such a chart into pdfReport - I do not know, you can either enter the equation directly (as I did in my tutorial) or just enter the resiult (G05Yes}, {G05No}
If it is not possible, so what?
You surely can insert a bar that shows the ratio - like the progress bar; it's only a filled rectangle and a not filled rectangle.
I still do not understand, why you want to have these charts created by LimeSurvey.
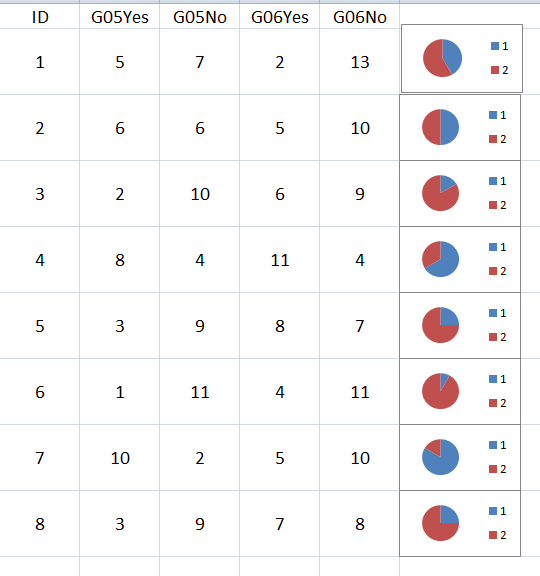
Isn't it sufficient to export the data - that include the variables "G05Yes", "G05No", and so on for all your groups.
Now you can add charts in Excel after each row (for each participant)
Here once created and then run a simple macro to repeat for all participants
And you can use these results to calculate a cluster analysis (just came to my mind)
But to be honest, I am tired to write English without reason and without seeing the design of your survey.
Joffm
This is the solution, except the wrong syntax of "sumifop"where the participants can answer "Yes", "No" and "n / a".
...
I would do it like this: {sumifop("Yes",G05Q01_SQ001_0,G05Q01_SQ001_1,
But I can't believe that you coded the answer options "Yes", "No", "n/a".
So, what are the codes?
Here I take
1: Yes
2: No
9: DK
Knowing that you have two equations, maybe named "G05Yes" and "G05No"
1. {sumifop("==","1",that.G05Q01.NAOK,that.G05Q02.NAOK,that.G05Q03.NAOK,...)} all questions of the group
2. {sumifop("!=","1",that.G05Q01.NAOK,that.G05Q02.NAOK,that.G05Q03.NAOK,...)} all questions of the group
Now the chart.
After you made sure that it is possible to include such a chart into pdfReport - I do not know, you can either enter the equation directly (as I did in my tutorial) or just enter the resiult (G05Yes}, {G05No}
If it is not possible, so what?
You surely can insert a bar that shows the ratio - like the progress bar; it's only a filled rectangle and a not filled rectangle.
I still do not understand, why you want to have these charts created by LimeSurvey.
Isn't it sufficient to export the data - that include the variables "G05Yes", "G05No", and so on for all your groups.
Now you can add charts in Excel after each row (for each participant)
Here once created and then run a simple macro to repeat for all participants
And you can use these results to calculate a cluster analysis (just came to my mind)
But to be honest, I am tired to write English without reason and without seeing the design of your survey.
Joffm
Volunteers are not paid.
Not because they are worthless, but because they are priceless
Please Log in to join the conversation.
- Joffm
-
- Offline
- LimeSurvey Community Team
-
Less
More
- Posts: 12941
- Thank you received: 3979
1 month 3 weeks ago #258092
by Joffm
Volunteers are not paid.
Not because they are worthless, but because they are priceless
Replied by Joffm on topic Generate statistics from matrix question group with equation
Hi,
In my opinion the bootstrap progressbar is not too bad.
Joffm
In my opinion the bootstrap progressbar is not too bad.
Joffm
Volunteers are not paid.
Not because they are worthless, but because they are priceless
Please Log in to join the conversation.