- Posts: 35
- Thank you received: 6
Welcome to the LimeSurvey Community Forum
Ask the community, share ideas, and connect with other LimeSurvey users!
Chartjs.org and Limesurvey
- linuxhooligan
-
 Topic Author
- Offline
- Junior Member
-

Less
More
5 months 3 weeks ago #251712
by linuxhooligan
Chartjs.org and Limesurvey was created by linuxhooligan
Please help us help you and fill where relevant:
Your LimeSurvey version: Version 5.6.43+231030
Own server or LimeSurvey hosting: vps
Survey theme/template:
==================
I wanted to insert a donut chart using Chartjs.org into LS as per this tutorial: www.w3schools.com/js/tryit.asp?filename=tryai_chartjs_doughnut
I found this reference on the forum on how to wrap the js code with $(document)... so that the rendering is fired when the whole document is loaded here: forums.limesurvey.org/forum/can-i-do-thi...e-of-chartjs-library
Here is the code that I input in a Text Display field:
<script src=" cdnjs.cloudflare.com/ajax/libs/Chart.js/2.9.4/Chart.js ">
<script type="text/javascript">
$(document).on('ready pjax:scriptcomplete',function(){
var barColors = [
"rgba(0,0,255,1.0)",
"rgba(0,0,255,0.") ",
",
"rgba(0,0,255,0.6)",
"rgba(0,0,255,0.4)",
"rgba(0,0,255,0.2)",
];
new Chart("myChart", {
type: "pie",
data: {
labels: xValues,
datasets: [{
backgroundColor: barColors,
data: yValues
}]
},
options: {
title: {
display: true,
text: "World Wide Wine Production"
}
}
});
});
</script>
<div class="content">
<div class="wrapper" style="max-width: 800px; margin: auto"><canvas id="myChart"></canvas></div>
</div>
However, the chart doesn't render.
Does anyone have any suggestions or working examples of the use of Chratjs.org in LS 5.x?
Thanks.
Your LimeSurvey version: Version 5.6.43+231030
Own server or LimeSurvey hosting: vps
Survey theme/template:
==================
I wanted to insert a donut chart using Chartjs.org into LS as per this tutorial: www.w3schools.com/js/tryit.asp?filename=tryai_chartjs_doughnut
I found this reference on the forum on how to wrap the js code with $(document)... so that the rendering is fired when the whole document is loaded here: forums.limesurvey.org/forum/can-i-do-thi...e-of-chartjs-library
Here is the code that I input in a Text Display field:
<script src=" cdnjs.cloudflare.com/ajax/libs/Chart.js/2.9.4/Chart.js ">
<script type="text/javascript">
$(document).on('ready pjax:scriptcomplete',function(){
var barColors = [
"rgba(0,0,255,1.0)",
"rgba(0,0,255,0.
","rgba(0,0,255,0.6)",
"rgba(0,0,255,0.4)",
"rgba(0,0,255,0.2)",
];
new Chart("myChart", {
type: "pie",
data: {
labels: xValues,
datasets: [{
backgroundColor: barColors,
data: yValues
}]
},
options: {
title: {
display: true,
text: "World Wide Wine Production"
}
}
});
});
</script>
<div class="content">
<div class="wrapper" style="max-width: 800px; margin: auto"><canvas id="myChart"></canvas></div>
</div>
However, the chart doesn't render.
Does anyone have any suggestions or working examples of the use of Chratjs.org in LS 5.x?
Thanks.
Please Log in to join the conversation.

- linuxhooligan
-
Topic Author
- Offline
- Junior Member
-
Less
More
- Posts: 35
- Thank you received: 6
5 months 3 weeks ago #251713
by linuxhooligan
Replied by linuxhooligan on topic Chartjs.org and Limesurvey
And the second part of the question is this:
If I am using the following code to add up values in LS:
{sum(if(Q01.code=="com",1,0),if(Q02.code=="com",1,0),if(Q03.code=="com",1,0),if(Q04.code=="com",1,0),if(Q05.code=="com",1,0),if(Q06_com01.NAOK=="Y",1,0),if(Q06_com02.NAOK=="Y",1,0),if(Q06_com03.NAOK=="Y",1,0),if(Q06_com04.NAOK=="Y",1,0))}
How do I assign the value of the above formula in to a js variable?
Please Log in to join the conversation.
- tpartner
-
- Offline
- LimeSurvey Community Team
-

Less
More
- Posts: 10109
- Thank you received: 3595
5 months 3 weeks ago #251733
by tpartner
Cheers,
Tony Partner
Solutions, code and workarounds presented in these forums are given without any warranty, implied or otherwise.
Replied by tpartner on topic Chartjs.org and Limesurvey
Can you attach a small sample survey (.lss file) containing only the relevant questions?
Cheers,
Tony Partner
Solutions, code and workarounds presented in these forums are given without any warranty, implied or otherwise.
Please Log in to join the conversation.
- linuxhooligan
-
Topic Author
- Offline
- Junior Member
-
Less
More
- Posts: 35
- Thank you received: 6
5 months 3 weeks ago - 5 months 3 weeks ago #251757
by linuxhooligan
Replied by linuxhooligan on topic Chartjs.org and Limesurvey
Okay, details:
1) RESOLVED - Inserting Plotly.js or Chart.js into a survey.
The key is the ORDER in which you organize the <div>, <canvas> <script src="..."> and <script> sections. Basically, both projects want:
a) The <div> or <canvas> dom objects inserted first in the code.
b) Then they want the <script src..> next
c) Followed by the <script> code it self that does the drawing.
If the objects from a) above are last nothing renders. There doesn't seem to be a need to wrap everything in a $(document).on('ready pjax:scriptcomplete',function(){} function, at least for now.
I have attached a sample .LSS file to show how this is done. Everything is in one group for explanation purposes.
2) QUESTION - Is it possible to have values from any field affect the values that the JS charting tools use to generate the graphs, either on the same page (same group) or the next page (next group)? Please note that the use case for the use of these sorts of graphing tools is to provide someone taking a survey immediate visual results. I recognize that any graphing that needs to be performed on aggregate data analysis is not probably not a good candidate for this sort of tool.
If yes, how is this done?
Thanks.
Attachments:
Last edit: 5 months 3 weeks ago by linuxhooligan.
Please Log in to join the conversation.
- Joffm
-

- Offline
- LimeSurvey Community Team
-
Less
More
- Posts: 12941
- Thank you received: 3979
5 months 3 weeks ago #251759
by Joffm
Volunteers are not paid.
Not because they are worthless, but because they are priceless
Replied by Joffm on topic Chartjs.org and Limesurvey
Hi, you may use ExpressionScript.
Here two examples:
1. with "highcharts"
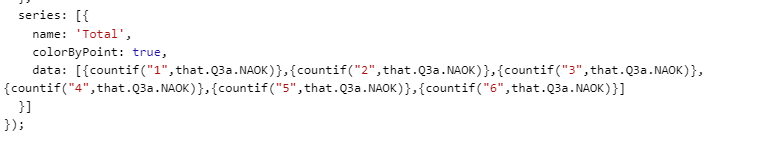
You see, I enter the "ExpressionScript" function directly

2. Google charts
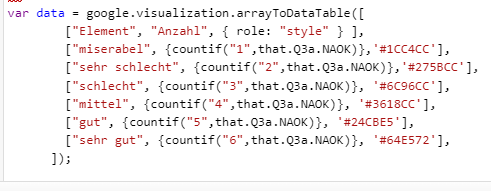
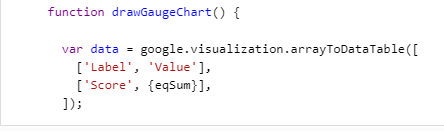
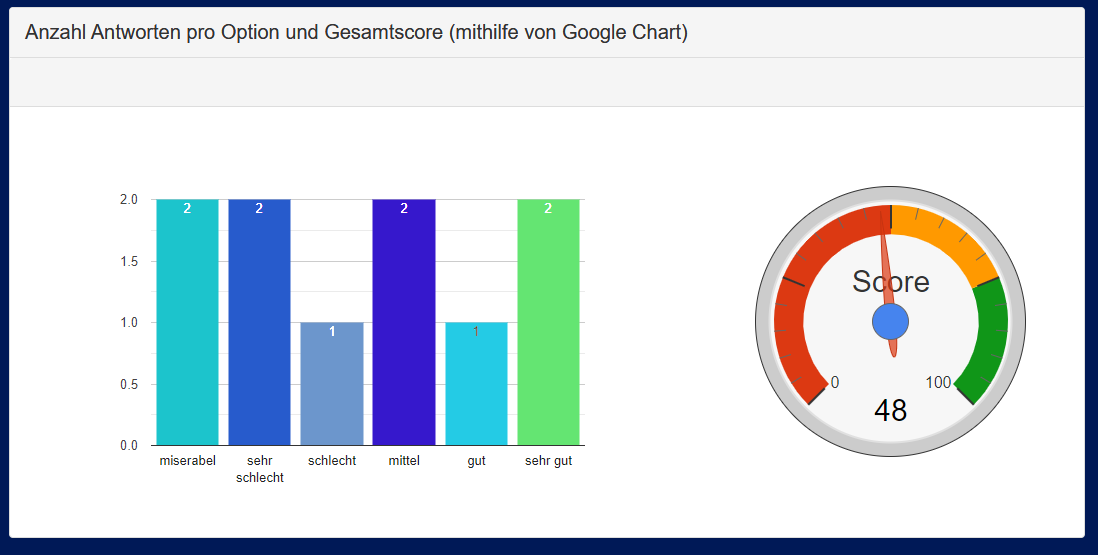
So, it shouldn't be really different, if you enter your "sum" functions.
Joffm
Here two examples:
1. with "highcharts"
You see, I enter the "ExpressionScript" function directly
2. Google charts
So, it shouldn't be really different, if you enter your "sum" functions.
Joffm
Volunteers are not paid.
Not because they are worthless, but because they are priceless
The following user(s) said Thank You: DenisChenu, tpartner
Please Log in to join the conversation.
- tpartner
-
- Offline
- LimeSurvey Community Team
-
Less
More
- Posts: 10109
- Thank you received: 3595
5 months 3 weeks ago #251765
by tpartner
Cheers,
Tony Partner
Solutions, code and workarounds presented in these forums are given without any warranty, implied or otherwise.
Replied by tpartner on topic Chartjs.org and Limesurvey
Yes, as Joffm points out, since the script is in the question source, you can use ExpressionScript directly in the JavaScript.
Bear in mind that since the chart is initiated on page load, the ExpressionScript variables should be on previous pages and the chart will not be dynamic to any changes made on this page.
Bear in mind that since the chart is initiated on page load, the ExpressionScript variables should be on previous pages and the chart will not be dynamic to any changes made on this page.
Cheers,
Tony Partner
Solutions, code and workarounds presented in these forums are given without any warranty, implied or otherwise.
Please Log in to join the conversation.
- linuxhooligan
-
Topic Author
- Offline
- Junior Member
-
Less
More
- Posts: 35
- Thank you received: 6
5 months 3 weeks ago - 5 months 3 weeks ago #251768
by linuxhooligan
Replied by linuxhooligan on topic Chartjs.org and Limesurvey
Aha!
That worked. Dropping by to provide details and a sample survey. To get Chartjs and Plotly to work in LS:
1) The first critical, yet not immediately obvious, item to keep in mind is that you need to have the order of <div> objects in the correct order that both javascript graphing tools expect.
This is just to get them to render, they won't render even if you get everything else right.
2) The second critical thing to keep in mind is that both objects need to be in a separate group from the form capturing the data in order to render as mentioned by tpartner.
Hopefully that helps other noobs.
Thanks to Tpartner and Joffm!
Attachments:
Last edit: 5 months 3 weeks ago by linuxhooligan.
Please Log in to join the conversation.