Welcome to the LimeSurvey Community Forum
Ask the community, share ideas, and connect with other LimeSurvey users!
Search Results (Searched for: background)
- tammo

07 Mar 2024 22:02
Adding extra logo in theme was created by tammo
Please help us help you and fill where relevant:
Your LimeSurvey version: 6.4
Own server or LimeSurvey hosting: Own
Survey theme/template: Extended Vanilla
==================
I am extending Vanilla and want to add a second logo, but run into a wall.
In config.xml I added:
Of course the first logo was already in config.xml
But adding the second logo seemed impossible: when going to the theme options I cannot see the files list. Opening the flies list show an empty list.
Strange enough I can add a Background dialog in config.xml and this show normally.
I must be doing something wrong, but after some hours I ask for help here? What goes wrong?
Thanks in advance,
Your LimeSurvey version: 6.4
Own server or LimeSurvey hosting: Own
Survey theme/template: Extended Vanilla
==================
I am extending Vanilla and want to add a second logo, but run into a wall.
In config.xml I added:
Code:
<!-- logo1 -->
        <brandlogo type="buttons" category="Logos" width="4" title="Logo" options="on|off" optionlabels="Yes|No">on</brandlogo>
        <brandlogofile type="dropdown" category="Logos" width="6" title="Logo file" parent="brandlogo">files/logo.png</brandlogofile>
        <!-- logo2 -->
        <logo2 type="buttons" category="Logos" width="4" title="Second logo" options="on|off" optionlabels="Yes|No">on</logo2>
        <logo2file type="dropdown" category="Logos" width="6" title="Second logo file" parent="logo2">files/logo.png</logo2file>
But adding the second logo seemed impossible: when going to the theme options I cannot see the files list. Opening the flies list show an empty list.
Strange enough I can add a Background dialog in config.xml and this show normally.
Code:
<backgroundimage type="buttons" category="Background" width="4" title="Background image" options="on|off" optionlabels="Yes|No">on</backgroundimage>
        <backgroundimagefile type="dropdown" category="Background" width="6" title="Background image file" parent="backgroundimage">files/pattern.jpg</backgroundimagefile>
Thanks in advance,
- Joffm

05 Mar 2024 22:51
Replied by Joffm on topic Changing Bootstrap bouton question
You already showed some variations of the class ".btn-primary" (background-color and border-color.
So you know where this is placed.
To test I'd always insert it into the question text (with <style>...</style> tags).
Later you can decide whether to place it in the "custom.css"
Did you investigate with the webdevelopment tool?
Here you see the actual settings of ".btn" or ".btn-primary" and can directly change some values and see the effect.
Joffm
- Bti2024

04 Mar 2024 23:09 - 04 Mar 2024 23:37
Changing Bootstrap bouton question was created by Bti2024
Please help us help you and fill where relevant:
Your LimeSurvey version: LimeSurvey Cloud
Version 5.6.56
Own server or LimeSurvey hosting:
Survey theme/template:
==================
Hi,
I need to change the rectangles Bootstrap boutons (see the attached picture), to oval's or round's ones, is it possible? if yes please send the css code and/or advice how to do it.
I have this code in the custom.css:
.btn-primary {
background-color: #2473B9;
border-color: #2473B9;
}
.btn-primary:hover {
background-color: #2473B9;
border-color: #2473B9;
}
.btn-primary:active,
.btn-primary.active {
background-color: #76C1E2 !important;
border-color: #76C1E2 !important;
}
Thanks in advance.
- CarinaHinterberger
01 Mar 2024 15:07
Replied by CarinaHinterberger on topic Generate statistics from matrix question group with equation
Hi holch, thanks for responding!
The graph is not for the respondent and should not be accessible to them, it should be easily accessible in the background, preferably within the statistics section of Lime Survey so I don't have to export the data.... So I want Lime to calculate the ratio of Yes to No and n/a answers for each question group and then I want to access this calculation again and plot a pie chart displaying Yes vs. No.
The point is to see in the background how many of the certificates listed in the survey(each line in the matrix equals one certificate) are applicable to the respondent. I want to generate this for every question group and the end goal is to display a report sheet, which shows only the accumulated pie chart for each group as a quick overview.
- CarinaHinterberger
01 Mar 2024 10:01 - 01 Mar 2024 12:13
Generate statistics from matrix question group with equation was created by CarinaHinterberger
Please help us help you and fill where relevant:
Your LimeSurvey version: Cloud Version 6.4.10
Own server or LimeSurvey hosting:
Survey theme/template: Fruity
==================
Hello, first time posting and pretty new to Lime Survey, so please let me know if I am missing something.
I am trying to generate a statistical output after every question group I have. Most of my question groups consist of Matrix type questions where the participants can answer "Yes", "No" and "n / a". I want to have a pie chart, showing the ratio of Yes compared to the other two options. I only want to see results from one participant at the time, so I don't need the data to accumulate from different responses.
So far I tried to create a new question Equation type at the end of each question group and collect the data there. I would do it like this: {sumifop("Yes",G05Q01_SQ001_0,G05Q01_SQ001_1,G05Q01_SQ002_0,G05Q01_SQ002_1,G05Q01_SQ003_0,G05Q01_SQ003_1,G05Q01_SQ004_0,G05Q01_SQ004_1,G05Q01_SQ005_0,G05Q01_SQ005_1)}
Is this already collecting the data in the background? And how can I display it in a pie chart - so I see each group result by itself?
I would really appreciate any pointer in the right direction!
- holch

27 Feb 2024 13:58
Handle this with care.
If Denis says "not too complex" I would assume that it is fairly complex for "normal" people. Denis is not "normal" as in he is one of the most experienced developers of Limesurvey plugins, just as background info.")
Replied by holch on topic access restrictions to replies
not to complex sounds good.
Handle this with care.
If Denis says "not too complex" I would assume that it is fairly complex for "normal" people. Denis is not "normal" as in he is one of the most experienced developers of Limesurvey plugins, just as background info.
- DenisChenu

27 Feb 2024 10:49
Replied by DenisChenu on topic access restrictions to replies
Then a plugin seems the best solution, not too complex here : just send false for responses and staticticsno, different background. in itself, a plugin would be great where I don't set the answers and statistics to load when answers are available, but when the user is superadmin (or similar).
- Micha_Malina
27 Feb 2024 10:45
Replied by Micha_Malina on topic access restrictions to replies
no, different background. in itself, a plugin would be great where I don't set the answers and statistics to load when answers are available, but when the user is superadmin (or similar). In the case of evaluations, not research, it is important for data protection reasons that the user can design and initiate the evaluation, but cannot view the individual responses.
- ngolub
23 Feb 2024 10:27
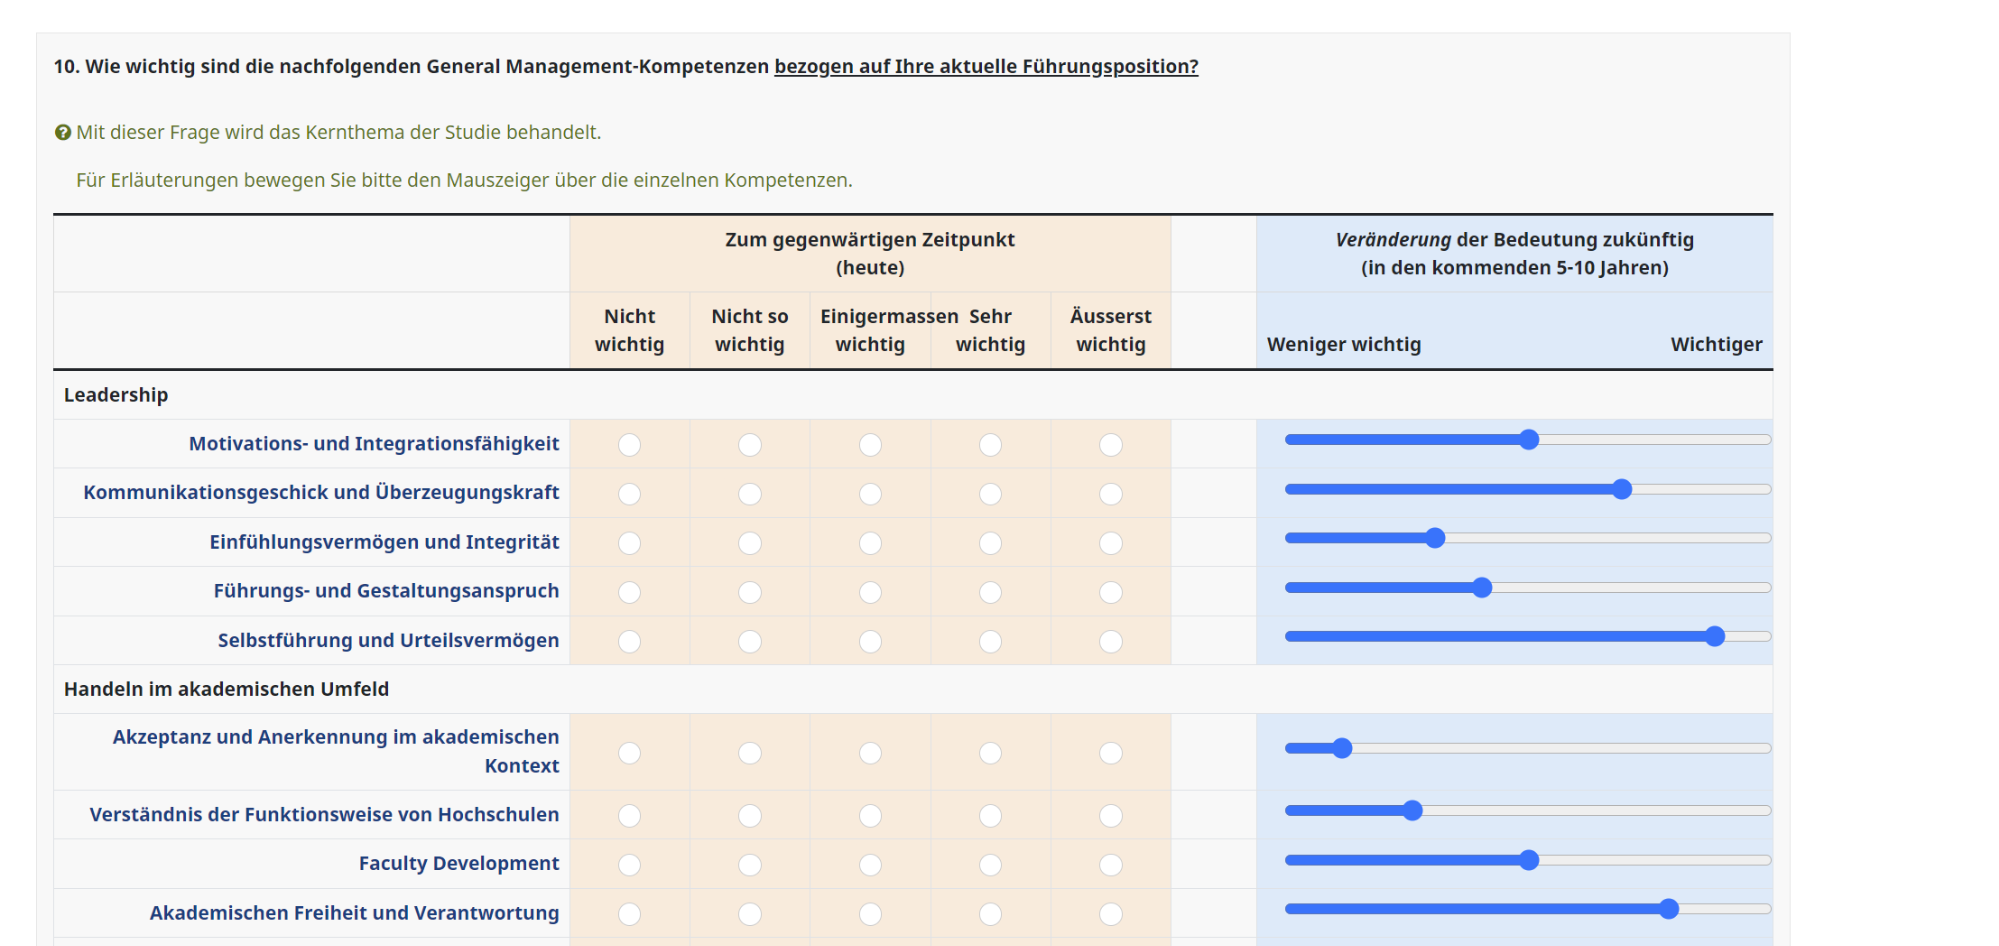
Replied by ngolub on topic Implementation eines Sliders in der 2ten Skala eines Dual Arrays.
Habe an dieser Frage weitergearbeitet und konnte jetzt den Schieberegler auf einer anderen Art und Weise implementieren:
Code:
<p><strong>10. Wie wichtig sind die nachfolgenden General Management-Kompetenzen <u>bezogen auf Ihre aktuelle Führungsposition?</u></strong></p>
<script type="text/javascript">
  $(document).ready(function() {
    // Identify this question
    var thisQuestion = $('#question1784');

    // Define the sub-heading text strings with tooltip text using the title attribute
    var subHeading1 = '<strong title="Your detailed information for Leadership">Leadership</strong>';
    var subHeading2 = '<strong title="Your detailed information for Academic Environment">Handeln im akademischen Umfeld</strong>';
    var subHeading3 = '<strong title="Your detailed information for Political Environment">Handeln im politischen Umfeld</strong>';
    var subHeading4 = '<strong title="Your detailed information for Strategic Design">Strategisches Gestaltungsvermögen</strong>';
    var subHeading5 = '<strong title="Your detailed information for Business Thinking">Betriebswirtschaftliches Denken und Handeln</strong>';
    var subHeading6 = '<strong title="Your detailed information for Organizational Change">Den organisatorischen Wandel gestalten</strong>';

    // Find out the number of columns in the question
    var columnsLength = $('tr.answers-list:eq(0) > *', thisQuestion).length;

    // Insert the subheadings before the specific subquestions
    $('tr.answers-list:eq(0)', thisQuestion).before('<tr class="sub-header-row"><th colspan="'+columnsLength+'">'+subHeading1+'</th></tr>');
    $('tr.answers-list:eq(5)', thisQuestion).before('<tr class="sub-header-row"><th colspan="'+columnsLength+'">'+subHeading2+'</th></tr>');
    $('tr.answers-list:eq(10)', thisQuestion).before('<tr class="sub-header-row"><th colspan="'+columnsLength+'">'+subHeading3+'</th></tr>');
    $('tr.answers-list:eq(15)', thisQuestion).before('<tr class="sub-header-row"><th colspan="'+columnsLength+'">'+subHeading4+'</th></tr>');
    $('tr.answers-list:eq(19)', thisQuestion).before('<tr class="sub-header-row"><th colspan="'+columnsLength+'">'+subHeading5+'</th></tr>');
    $('tr.answers-list:eq(24)', thisQuestion).before('<tr class="sub-header-row"><th colspan="'+columnsLength+'">'+subHeading6+'</th></tr>');

    // Fix the row classes for styling
    var rowClass = 1;
    $('table.subquestion-list tbody tr', thisQuestion).each(function(i) {
      if($(this).hasClass('sub-header-row')) {
        rowClass = 1;
      } else {
        rowClass++;
        $(this).removeClass('array1 array2');
        if(rowClass % 2 == 0) {
          $(this).addClass('array2');
        } else {
          $(this).addClass('array1');
        }
      }
    });

    // Initialize Bootstrap tooltips
    $('[data-bs-toggle="tooltip"]').tooltip();
  });
</script><script>
document.addEventListener("DOMContentLoaded", function() {
    // Target the specific question part for future importance with question ID 1903
    var questionBaseId = "866522X20X1784"; // Base ID format in LimeSurvey might include the survey ID and question ID
    var questionPart = "1"; // Part 2 of the dual array, indicating future importance

    // Hide existing radio buttons for the second part of the question
    document.querySelectorAll('input[name^="' + questionBaseId + '#"]').forEach(function(radio) {
        radio.closest('td').style.display = 'none'; // Hide the table cell containing the radio button
    });

    // Loop through each sub-question to add a slider
    document.querySelectorAll('[id^="javatbd' + questionBaseId + '"]').forEach(function(subQuestionRow) {
        var subQuestionId = subQuestionRow.id.match(/\d+$/)[0]; // Extract the numeric part (sub-question ID)

        // Create a new slider input
        var slider = document.createElement("input");
        slider.setAttribute("type", "range");
        slider.setAttribute("min", "-1"); // Assuming scale starts at 1
        slider.setAttribute("max", "1"); // Assuming scale ends at 3, adjust as per your scale
        slider.setAttribute("value", "0"); // Default value, can be adjusted
        slider.setAttribute("step", "0.1"); // Set the step interval to 0.1
        slider.setAttribute("class", "future-importance-slider"); // For styling if needed
        slider.setAttribute("id", questionBaseId + "_" + subQuestionId + "_slider");

        // Find the cell where the slider should be placed
        var sliderCell = subQuestionRow.querySelector('td:last-child');
        if (sliderCell) {
            // Clear the cell and append the slider to this cell
            sliderCell.innerHTML = ''; // This removes any existing content, like improperly placed sliders
            sliderCell.appendChild(slider); // Append the slider to the cell
        }

        // Update a hidden input or perform other actions when the slider value changes
        slider.addEventListener("input", function() {
            // Example: Update a hidden input field with the slider's value
            var hiddenInput = document.querySelector('input[id="java' + questionBaseId + subQuestionId + '_' + questionPart + '"]');
            if(hiddenInput) {
                hiddenInput.value = this.value;
            }
        });
    });
});

</script>
<style type="text/css">.tooltip[data-toggle="tooltip"] {
    cursor: pointer;
  }

/* Styles for your .mytooltip1 elements */
.mytooltip1 {
  cursor: pointer;
  font-weight: bold;
  color: #08407E;
}


.tooltip-inner{
    min-width:500px;
    height:auto;
    padding:3px 8px;
    color:#314A5B;
    text-align:left;
    font-weight:400;
    border-radius:15px;
    border: 1px solid #314A5B;
    background-color:white;
    font-size: 16px;
}


    .coloured-array.array-flexible-dual-scale .column-1 {    background-color:  rgba(255, 204, 153, 0.3);}
    .coloured-array.array-flexible-dual-scale .column-2 {    background-color:  rgba(255, 204, 153, 0.3);}
    .coloured-array.array-flexible-dual-scale .column-3 {    background-color:  rgba(255, 204, 153, 0.3);}
    .coloured-array.array-flexible-dual-scale .column-4 {    background-color:  rgba(255, 204, 153, 0.3);}
    .coloured-array.array-flexible-dual-scale .column-5 {    background-color:  rgba(255, 204, 153, 0.3);}
    .coloured-array.array-flexible-dual-scale .column-6 {     background-color: rgba(153, 204, 255, 0.3);}
    .coloured-array.array-flexible-dual-scale .column-7 {     background-color: rgba(153, 204, 255, 0.3);}
    .coloured-array.array-flexible-dual-scale .column-8 {     background-color: rgba(153, 204, 255, 0.3);}
    .coloured-array.array-flexible-dual-scale .column-9 {     background-color: rgba(153, 204, 255, 0.3);}
    .coloured-array.array-flexible-dual-scale .column-10 {   background-color: rgba(153, 204, 255, 0.3);}
    th.dsheader:nth-of-type(2) {    background-color:  rgba(255, 204, 153, 0.3);}
    th.dsheader:nth-of-type(3) {    background-color:  rgba(153, 204, 255, 0.3);}
    td.answer_cell_1_1 {    background-color:  rgba(255, 204, 153, 0.3);}
    td.answer_cell_1_2 {    background-color:  rgba(255, 204, 153, 0.3);}
    td.answer_cell_1_3 {    background-color:  rgba(255, 204, 153, 0.3);}
    td.answer_cell_1_4 {    background-color:  rgba(255, 204, 153, 0.3);}
    td.answer_cell_1_5 {    background-color:  rgba(255, 204, 153, 0.3);}
    td.answer_cell_2_1 {    background-color: rgba(153, 204, 255, 0.3);}
    td.answer_cell_2_2 {    background-color: rgba(153, 204, 255, 0.3);}
    td.answer_cell_2_3 {    background-color: rgba(153, 204, 255, 0.3);}
    td.answer_cell_2_4 {    background-color: rgba(153, 204, 255, 0.3);}
    td.answer_cell_2_5 {    background-color: rgba(153, 204, 255, 0.3);}
    th#answer866522X20X1784_0-1 {    background-color: rgba(255, 204, 153, 0.3);}
    th#answer866522X20X1784_0-2 {    background-color: rgba(255, 204, 153, 0.3);}
    th#answer866522X20X1784_0-3 {    background-color: rgba(255, 204, 153, 0.3);}
    th#answer866522X20X1784_0-4 {    background-color: rgba(255, 204, 153, 0.3);}
    th#answer866522X20X1784_0-5 {    background-color: rgba(255, 204, 153, 0.3);}
    th#answer866522X20X1784_1-1 {    background-color: rgba(153, 204, 255, 0.3);}
    th#answer866522X20X1784_1-2 {    background-color: rgba(153, 204, 255, 0.3);}
    th#answer866522X20X1784_1-3 {    background-color: rgba(153, 204, 255, 0.3);}
    th#answer866522X20X1784_1-4 {    background-color: rgba(153, 204, 255, 0.3);}
    th#answer866522X20X1784_1-5 {    background-color: rgba(153, 204, 255, 0.3);}
</style>
<style type="text/css">/* Hide the red warning message for mandatory multiple choice questions */
  div.ls-question-mandatory-multiplechoice,
  div.ls-question-mandatory.ls-question-mandatory-other-text-danger,
  div.ls-question-mandatory.ls-question-mandatory-other,
  /* Add the class for mandatory multiple numerical input questions */
  div.ls-question-mandatory.ls-question-mandatory-array.text-danger {
      display: none;
  }
</style>
<style type="text/css"><style>
    /* Override the width of the columns for the sliders */
    .ls-answers table .group-2 col {
        width: 45% !important; /* This width should match the combined width of the other columns */
    }

    /* Ensure the sliders span the full width of the table cell */
    .future-importance-slider {
        width: 100%; /* Make sure the slider takes up the full width */
    }
</style>
<script type="text/javascript" charset="utf-8">
  $(document).on('ready pjax:scriptcomplete',function(){
    var thisQuestion = $('#question1784');
    // Add a question class
    thisQuestion.addClass('custom-array');

    // Column-specific classes
    $('table.subquestion-list tr', thisQuestion).each(function(i) {
      $('th, td', this).each(function(i) {
        $(this).addClass('column-'+i);
      });
    });
  });
</script>
<style type="text/css">.custom-array table.subquestion-list col {
    width: auto !important;
  }

  .custom-array table.subquestion-list thead .column-0 {  width: 30%; }
  .custom-array table.subquestion-list thead .column-2 {  width: 35%; }
  .custom-array table.subquestion-list thead .column-3 {  width: 5%; }
  .custom-array table.subquestion-list thead .column-5 {  width: 30%; }
</style>
- BrunoLime
22 Feb 2024 14:54
No logos in admin login page when LS was installed into subfolder was created by BrunoLime
Please help us help you and fill where relevant:
Your LimeSurvey version: 6.4.8
Own server or LimeSurvey hosting: Own
Survey theme/template: Sea Green (Administration theme)
==================
Hi,
I installed LimeSurvey into a subfolder from my document root and noticed, that there are no logos and graphics shown in the admin login screen (see screenshot attached). When installed directly in document root, the logos and decor appear.
I found in the template files of Sea Green theme that the location of the images for logo and decor are hardcoded to document root.
E.g. in assets/admin_themes/Sea_Green/authentication/authentication.scss:
I think it should be without the slash before assets/... to let it work in subfolders, too
Maybe someone can check this and put the correction into the code?
Thank you
Bruno
Your LimeSurvey version: 6.4.8
Own server or LimeSurvey hosting: Own
Survey theme/template: Sea Green (Administration theme)
==================
Hi,
I installed LimeSurvey into a subfolder from my document root and noticed, that there are no logos and graphics shown in the admin login screen (see screenshot attached). When installed directly in document root, the logos and decor appear.
I found in the template files of Sea Green theme that the location of the images for logo and decor are hardcoded to document root.
E.g. in assets/admin_themes/Sea_Green/authentication/authentication.scss:
Code:
background: url(/assets/images/decor-1.png) no-repeat center;
I think it should be without the slash before assets/... to let it work in subfolders, too
Code:
background: url(assets/images/decor-1.png) no-repeat center;
Maybe someone can check this and put the correction into the code?
Thank you
Bruno
- holch
22 Feb 2024 14:23
The initial discussion was about 2000+ responses. While 20000 is of course within "2000+" I assumed that the responses might be between 2000-3000 max. Not 20000 or more.
It is not overly surprising that you might run into some issues when exporting 20000+ responses and the maximum execution time is 1 minute. If you can't adapt the max execution time, you need to speed up the process. Either by exporting in batches or trying to get a quicker processer that can run the script in less time. But there might be also other factors that impact (the way how you connect to the database, etc). And you might also run into max_vars limits with this amount of responses.
Replied by holch on topic Is it possible to export survey data in the background?
Thank you, yet if the number of responses is over 20,000 or larger, it will still have timeout issue.
The initial discussion was about 2000+ responses. While 20000 is of course within "2000+" I assumed that the responses might be between 2000-3000 max. Not 20000 or more.
It is not overly surprising that you might run into some issues when exporting 20000+ responses and the maximum execution time is 1 minute. If you can't adapt the max execution time, you need to speed up the process. Either by exporting in batches or trying to get a quicker processer that can run the script in less time. But there might be also other factors that impact (the way how you connect to the database, etc). And you might also run into max_vars limits with this amount of responses.
- DenisChenu
22 Feb 2024 12:13
")
Replied by DenisChenu on topic Is it possible to export survey data in the background?
Then seems you need to export 5000 by 5000Thank you, yet if the number of responses is over 20,000 or larger, it will still have timeout issue.
- alucard001
22 Feb 2024 03:32
Replied by alucard001 on topic Is it possible to export survey data in the background?
Thank you, yet if the number of responses is over 20,000 or larger, it will still have timeout issue.
- alucard001
22 Feb 2024 03:29
Replied by alucard001 on topic Is it possible to export survey data in the background?
Thanks for your reference.
- tpartner
21 Feb 2024 19:41
Replied by tpartner on topic Is it possible to export survey data in the background?
Yeah, and maybe export using codes only.Check if exporting to CSV is maybe quicker. If so, convert the downloaded CSV to Excel later.