Statistiken
From LimeSurvey Manual
Zur Statistik-Funktion gelangt man, indem man zuerst auf der Hauptseite auf das "Ergebnisse dieser Umfrage"-Symbol und später auf das 
"Zeige Statistiken dieser Antworten"-Symbol klickt. Natürlich steht diese Funktion erst zur Auswahl, nachdem eine Umfrage aktiviert wurde.
Was ist die Statistik-Funktion?
Wenn sie eine Umfrage aktiviert haben und sie schon Ergebnisse bekommen haben oder diese schon beendet ist, möchten sie wahrscheinlich die Ergebnisse analysieren. Mit LimeSurvey können sie die Ergebnisse in ein Tabellenkalkulationsprogramm (OpenOffice, Excel,...) exportieren und dort dann alles mögliche damit anfangen. Als Alternative reicht jedoch für die viele Ansprüche die eingebaute Statistik-Funktion von LimeSurvey vollkommen aus. Nachfolgend möchten wir ihnen den Funktionsumfang kurz vorstellen.
Mit der Statistik-Funktion können sie Ergebnisse filtern und die Anzahl von Häufigkeiten sowie die entsprechenden Prozentwerte anzeigen lassen. Sie können zwar keine komplexen statistischen Tests durchführen, aber sie werden überrascht sein, welche Fülle an Informationen man aus einer deskriptiven Statistik herausholen kann.
Filtern von Ergebnissen/Daten
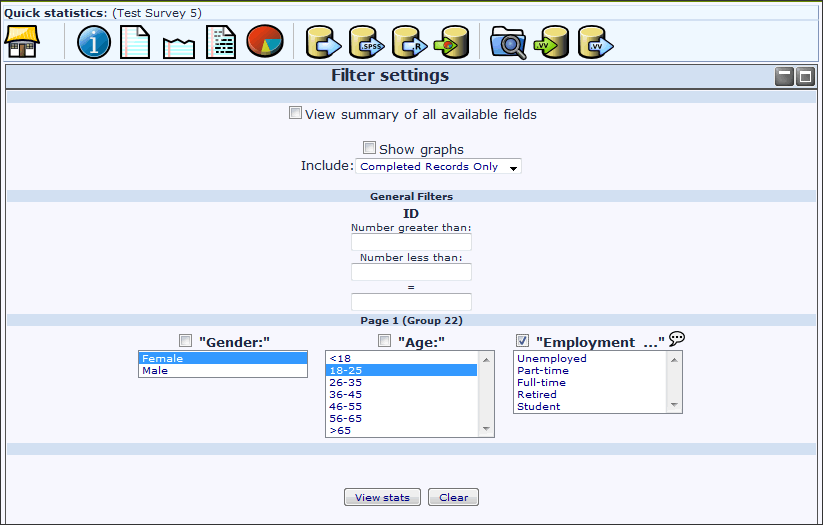
Nach einem Klick auf das Statistik-Symbol werden ihnen schön in Reihenfolge alle Gruppen und Fragen ihrer Umfrage aufgelistet. Von den Fragen wird jedoch nur der Fragencode angezeigt, der Fragetext zum entsprechenden Fragencode wird nach einem Klick auf das nebenstehende Lautsprechersymbol in einem Popup (oder aber auch, wenn man mit der Maus über das Sysmbol fährt) angezeigt . Mit einem Klick und dem Setzen eines Häckchen zu jeder Frage kann man festlegen, dass die Statistik zu dieser Frage ausgegeben wird, wenn man am Ende der Seite auf den "Statistik anzeigen"-Button klickt. Zu jeder Frage werden die vordefinierten Antworten aufgelistet. Anhand einer Selektion der Antworten können sie das Ergebnis der Statistik filtern. Sie können gleichzeitig mehrere Filter anwenden, verwenden sie hierzu die Steuerungstaste. Halten sie die Steuerungstaste gedrückt, und wählen sie die Antworten aus, nach denen gefiltert werden soll.
Nachdem sie ihre Filter gesetzt haben, drücken sie auf den "Statistik anzeigen"-Button am Ende der Seite und die von ihnen gewählte Statistik wird angezeigt.
Mit der Einstellung "Unvollständige Antworten filtern" können sie bestimmen, ob sie unvollständige Antworten in ihre Statistik-Auswertung einschließen wollen oder nicht. Für weitere Infos dazu sehen sie Umfrageergebnisse ansehen.
Ergebnisse und Zusammenfassung
Hier wird ihnen angezeigt, wie viele Datensätze in der Datenbank sind und wie viele davon für ihre Statistik herangezogen wurden (wenn sie keinen Filter gesetzt haben, werden alle Datensätze herangezogen). Die Statistik listet dann die Anzahl und den entsprechenden Prozentwert jeder Antwort auf.
Folgendes sollten sie beachten:
- Wenn sie einen Filter auf die Antwort einer Frage setzen, welche sie sich von der Statistik auch anzeigen lassen wollen, ist der Filter natürlich so definiert, dass die Statistik ein Ergebnis angezeigt, welches dem Kriterium entspricht. Deshalb sollten sie sich keine Zusammenfassung einer Frage anzeigen lassen, auf der sie ein Filterkriterium gesetzt haben.
- Um mehrere Antworten einer Frage auszuwählen, halten sie die Steuerungstaste gedrückt. Um alle gesetzten Filter zu löschen, klicken sie auf den "Löschen"-Button am unteren Ende der Seite.
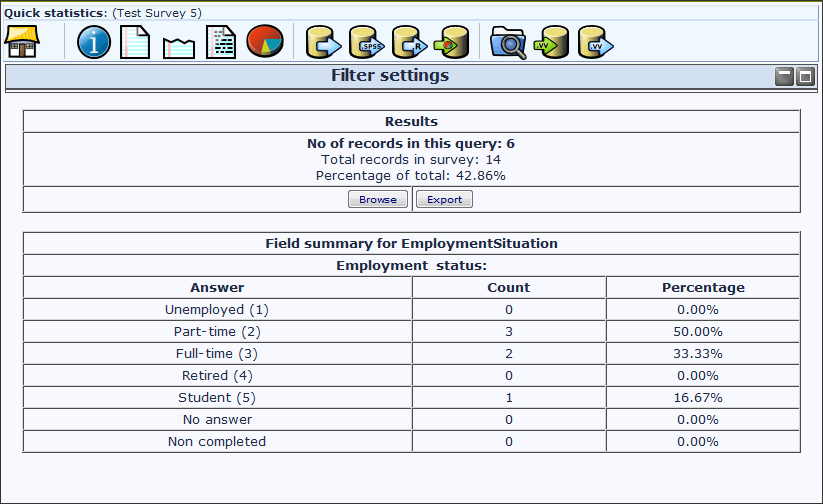
Selecting "View stats" will then give you the "Results" table, indicating the number of responses matching your criteria, and a "Field Summary" table for each question selected which will summarize all possible answers in the question(s), their totals and their percentage. It is important to note that these results are a subset of your total responses. So, for example, if your criteria display 146 records out of a total 180, the summary will show the breakdown of just those 146 records for that table.
The images below indicate that I have elected to view the stats for "Employment status" of completed records/female/age 18-25. This gives me the results for 6 out of 14 records.
Things to be cautious of
- If you set criteria on the same question that you ask for a summary, then that question will only present answers matching your criteria. So it is good practice not to set any criteria on the same question you are getting a summary of.
- To select multiple entries for a question hold down the CTRL button when clicking. To 'unselect' the last criteria (if you want to clear all criteria from a question) click on the last highlighted answer with the CTRL button.
Gefilterte Ergebnisse ansehen und exportieren
If you want to export the responses that match your criteria, click on the "export" button at the bottom of the 'Results' table. This will bring up the usual export screen, however when you export the results you will only receive the responses that match your criteria. Similarly, click on browse to view the matching responses in the browse screen.
Graphs
For charting the library pChart is used which is completely included and usually doesn't have to be configured.
However for some languages (like Chinese) the usual font used (Vera) does not cover the needed character set. In that case you can use the setting $chartfontfile to set a new TTF font file in config.php (Check out config-defaults.php for the right setting). For Chinese (Simplified and Traditional) we recommend to use the FireFlySung font which can be downloaded from [1].
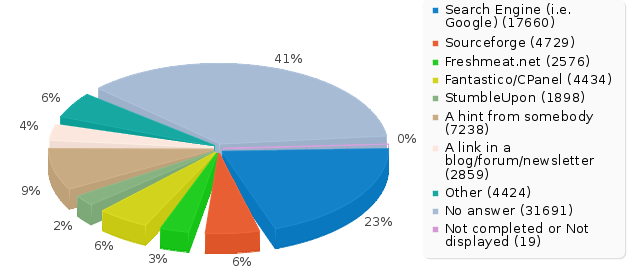
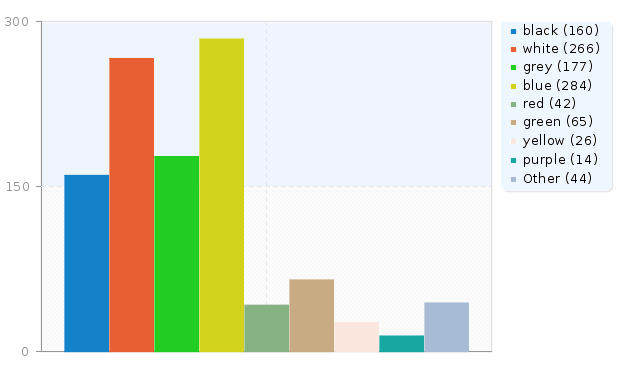
After the graphs have been generated you can export these graphs easily. Use a right-mouse-click over the image and choose "Save image as" and save the graph as a .png-file to your chosen location. Normally all results are displayed as pie charts - only for question type "Multiple Options" bar graphs are used.


"incomplete responses", "no answers" and not "completed/not displayed" counts
"incomplete responses" counts: all responses that started, but weren't completed. A response started when the participant clicked "Next" button in the survey, but click the "Submit" button in the end.
Technically speaking, this is when there is no SubmitDate in the response table for this entry, but new data set was created already.
A question with "no answer" counts: when the question was displayed, but the participant hasn't given an answer.
Technically speaking, this is when the question is not mandatory, was displayed, received no answer and the user clicked Next or Submit: the consequence is that the database field for this answer is set to "" (empty string). This "no answer" status cannot be really computed for Date or pure Numerical questions where the database field cannot record a string.
A question with "not completed/not displayed" counts: when the page containing the question was not displayed. This can be because of conditions, or just because the participant left the survey before this page was displayed (or just while this page is displayed, but without clicking the Next button).
Technically speaking, the database field for this question is filled with a NULL value.
Public Statistics
LimeSurvey includes functionality to display simple statistics to your participants after they have completed filling out an online survey.
There are two steps involved in activating and displaying statistics to your participants. Firstly you must enable public statistics for your survey (by default this is turned off). This setting is in your main survey toolbar, General Settings – in the Presentation and Navigation Tab. Look for the setting “Public Statistics”. There is also a setting here called “Show graphs in public statistics” which – if turned on – will show graphs as well as the counts (by default only numerical statistics are displayed).
Once you’ve set your survey to display statistics, you need to indicate question-by-question which statistics are displayed to your participants. By default, no questions are selected for display.
You choose which questions will be shown in the public statistics page by editing each question. In the Advanced Settings for each question is an option “Show in public statistics”. Once you set this advanced setting to “Yes” the question will be included on the public statistics page.
* Additional question attribute "public_statistics"
What participants see
Once you’ve enabled public statistics, and selected some questions to display, an additional option will be visible to participants when they’ve completed filling out your survey. In addition to the usual thank you, there will be a link to “View the statistics for this survey”
If your participants click on this link they will be able to see a page detailing the responses to the questions you’ve selected, and a graph (if you chose to display graphs too).
Changing the look of the public statistics page
The public statistics page has a template of it’s own that can be edited in the limesurvey template editor.

