Welcome to the LimeSurvey Community Forum

Ask the community, share ideas, and connect with other LimeSurvey users!

Comparative statistics

  • mussti
  • mussti's Avatar Topic Author
  • Offline
  • New Member
  • New Member
More
6 years 1 day ago #167765 by mussti
Comparative statistics was created by mussti
I did a survey and filled out 2-3 test-based surveys. But I have problems when looking at the statistics. For example, I give an example from the questions in the questionnaire.

What percentage of teachers are satisfied with their work. I want to look at statistics such as the number of hours of work or the time of the athletes.


1-What are you doing.
a- Engineer
b- Teacher
c- Athlete

2-Working hours
a- 08: 00-17: 00
b- 10: 00-14: 00
c: Free

3-Are you satisfied with your work?
a- Yes
b- No
c- Partially

I arranged the question types as LIST RADYO.
The topic has been locked.
  • Joffm
  • Joffm's Avatar
  • Offline
  • LimeSurvey Community Team
  • LimeSurvey Community Team
More
6 years 1 day ago #167772 by Joffm
Replied by Joffm on topic Comparative statistics
Hi, mussti,

LimeSurvey is not a statistic tool. The so called statistic only gives a very raw overview over frequencies.

You have three questions and in the raw LS overview you get the percentages of each question, but no combination.
The only thing you can do, is:
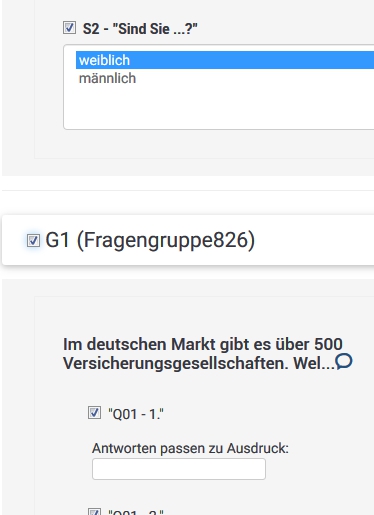
Filter by two of the three questions and have a look at the result.
Here I filtered the "females".
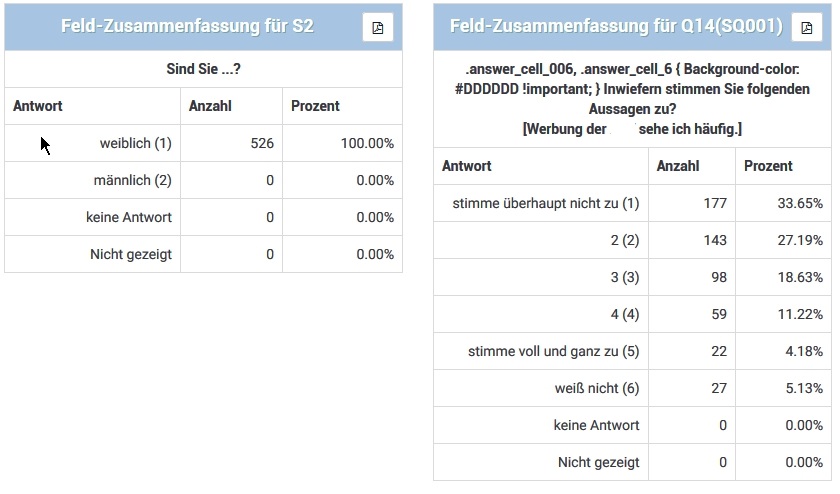

and got this


You see the right table only contains rhe result of the 526 filtered women.

But real analysis you do in a statistic tool like SPSS or PSPP (the open source clone of SPSS)
Or even EXCEL or OpenOffice/LibreOffice

Best regards
Joffm

Volunteers are not paid.
Not because they are worthless, but because they are priceless
The following user(s) said Thank You: holch
The topic has been locked.

Lime-years ahead

Online-surveys for every purse and purpose