- Posts: 11
- Thank you received: 3
Welcome to the LimeSurvey Community Forum
Ask the community, share ideas, and connect with other LimeSurvey users!
Charts not displaying correctly in Statistics Simple Mode - looking squashed
- iceclimber81
-
 Topic Author
- Offline
- New Member
-

Less
More
6 years 11 months ago #155188
by iceclimber81
Charts not displaying correctly in Statistics Simple Mode - looking squashed was created by iceclimber81
Dear LimeSurvey community,
When viewing the responses of my survey (67 questions, 17 complete responses) in simple mode, the bar charts for 13 questions are not displaying correctly - they look squashed or compressed; I'm attaching a screenshot for illustration (see question "What is your profession?"). This happens irrespective of which browser I use (Chrome, Safari).
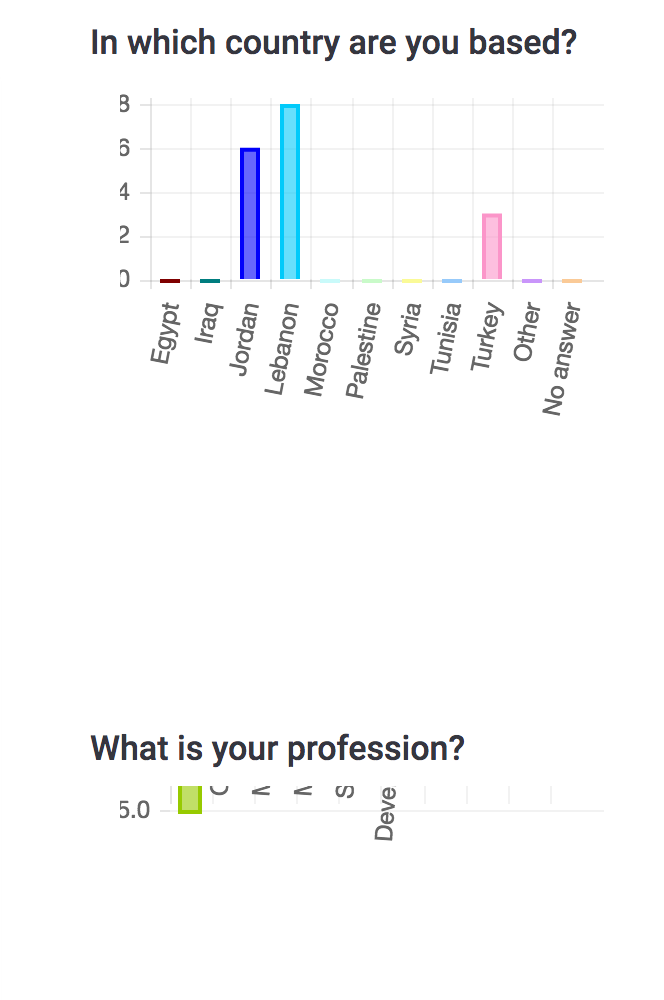
I cannot identify a pattern in which questions this happens. 5-item rating scale (radio button) questions and multiple-choice (checkbox) questions are equally affected.
The console does not display errors; it shows 2 warnings that don't look related to the problem:
Google Maps API warning: NoApiKeys
developers.google.com/maps/documentation...messages#no-api-keys
. util.js:219
Google Maps API warning: SensorNotRequired developers.google.com/maps/documentation...#sensor-not-required . util.js:219
I'm copying the HTML source code of the squashed chart below. Any ideas what could be wrong or how to fix this would be much appreciated.
When viewing the responses of my survey (67 questions, 17 complete responses) in simple mode, the bar charts for 13 questions are not displaying correctly - they look squashed or compressed; I'm attaching a screenshot for illustration (see question "What is your profession?"). This happens irrespective of which browser I use (Chrome, Safari).
I cannot identify a pattern in which questions this happens. 5-item rating scale (radio button) questions and multiple-choice (checkbox) questions are equally affected.
The console does not display errors; it shows 2 warnings that don't look related to the problem:
Google Maps API warning: SensorNotRequired developers.google.com/maps/documentation...#sensor-not-required . util.js:219
I'm copying the HTML source code of the squashed chart below. Any ideas what could be wrong or how to fix this would be much appreciated.
Code:
<div class="col-sm-4 printable" style="margin-top: 2em;margin-bottom: 2em;">
        <h4>What is your profession?</h4>
<!-- end of _statisticsoutput_header -->
<!-- _statisticsoutput_graphs -->
            <!-- Charts -->
        <div class="row">
            <div class="col-sm-9 vcenter chartjs-container" id="chartjs-container-18" data-chartname="" data-qid="18" data-type="Bar" data-color="36">

                            <canvas class="canvas-chart " id="chartjs-18" width="484" height="364" data-color="36" style="width: 242px; height: 182px;"></canvas>
            </div>

            <!-- legends -->
                    </div>

<!-- Buttons to change graph type -->
        <div id="stats_599194X4X18" class="graphdisplay" style="text-align:center">
        </div>

<script>
    statisticsData['quid'+'18'] = {
        labels : ["Mayor","Other elected local ...","Municipal or local g...","Municipal or local g...","Staff from Central A...","Development or Human...","NGO","Private sector","Other","No answer"],
        grawdata : ["5","0","4","4","1","0","1","0","2","0"], // the datas to generate the graph
    };
</script>
<!-- endof  _statisticsoutput_graphs -->
</div>
Attachments:
The topic has been locked.

- leonelcorso
-
- Offline
- New Member
-
Less
More
- Posts: 1
- Thank you received: 0
5 years 7 months ago #173360
by leonelcorso
Replied by leonelcorso on topic Charts not displaying correctly in Statistics Simple Mode - looking squashed
Hi, did you find the root cause and how to fix it?
I'm having the same issue
I'm having the same issue
Attachments:

The topic has been locked.
- Joffm
-

- Away
- LimeSurvey Community Team
-

Less
More
- Posts: 12923
- Thank you received: 3977
5 years 7 months ago #173366
by Joffm
Volunteers are not paid.
Not because they are worthless, but because they are priceless
Replied by Joffm on topic Charts not displaying correctly in Statistics Simple Mode - looking squashed
Hi,
there is already a post about that.
www.limesurvey.org/forum/installation-a-...ersion-3-14-1-180731
Well, how did you call the statistics?
Very strange:
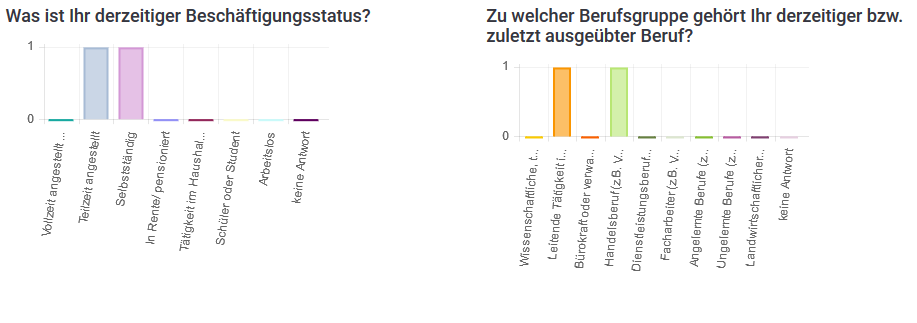
If I call the statistics from the top menu I can reproduce

If I use the sidebar, everything's fine:
Joffm
there is already a post about that.
www.limesurvey.org/forum/installation-a-...ersion-3-14-1-180731
Well, how did you call the statistics?
Very strange:
If I call the statistics from the top menu I can reproduce
If I use the sidebar, everything's fine:
Joffm
Volunteers are not paid.
Not because they are worthless, but because they are priceless
Attachments:
The topic has been locked.